

Entry-level data analytics roles: what to apply for and how to qualify
If you are searching for entry level data analytics jobs, apply first to roles where employers expect solid fundamentals rather than deep specialization: entry-level data analyst, junior data analyst, operations analyst, reporting analyst, business intelligence analyst, and data quality analyst. To qualify, you usually need SQL, Excel or Google Sheets, one dashboard tool such as Tableau or Power BI, basic statistics, and proof that you can turn messy data into a useful business answer.
That is the short answer. The harder part is knowing which titles actually fit your current skill level, which qualifications matter for different analytics tracks, and how much portfolio work is enough to get interviews. That is where most job seekers get stuck.
Which entry-level roles are actually worth applying for?
Many job titles sound similar, but they do not ask for the same depth. The best target is the role where your current toolset matches the day-to-day work, not just the title that looks most impressive.
| Role title | Typical work | Best fit if you have | Main watchout |
|---|---|---|---|
| Entry-level data analyst | Clean data, run queries, build reports, explain trends | Balanced SQL, Excel for data analysis, and dashboard basics | Some postings quietly expect prior internship experience |
| Junior data analyst | Support senior analysts with dashboards, ad hoc analysis, and reporting | Strong fundamentals but lighter business context | Title varies widely by company |
| Reporting or BI analyst | Create recurring dashboards and KPI reports | Power BI or Tableau plus SQL | Can become dashboard-heavy with less analytical depth |
| Operations analyst | Track processes, efficiency, inventory, staffing, or service metrics | Excel, SQL, and practical business reasoning | May require domain familiarity more than coding depth |
| Data quality analyst | Check data accuracy, consistency, duplicates, and process issues | Detail orientation and data cleaning strength | Less storytelling, more validation work |
Skip jobs that ask for advanced machine learning, production data engineering, or several years of experience unless the rest of the description is clearly junior. Some companies post “entry-level” roles that are not entry-level at all. If the posting centers on pipeline architecture, model deployment, or owning a company-wide analytics stack, it is probably the wrong target.
What employers usually mean by entry-level data analyst requirements
The baseline is not mysterious. Employers want evidence that you can work through the full analysis flow: get data, clean it, analyze it, and present a useful answer. The tools matter, but the workflow matters more.
- SQL for data analytics: querying, filtering, joining, grouping, and aggregating data.
- Excel or Google Sheets: formulas, lookups, pivot tables, and basic cleaning.
- Data visualization tools: Tableau or Power BI for charts and dashboards.
- Python for data analysis: commonly expected in many roles, especially for cleaning and repeatable analysis; R appears more often in some research-heavy environments.
- Statistics: descriptive statistics, basic probability, and sometimes regression basics or A/B testing.
- Communication: explaining findings clearly to non-technical stakeholders.
That list looks simple on paper, but hiring managers often screen for combinations. SQL alone is not enough. A polished dashboard alone is not enough. The stronger signal is showing that you queried raw data, cleaned it, chose the right metric, and explained what decision a stakeholder should make next. If you are comparing analytics pathways with adjacent roles, the differences in expectations become clearer when you look at data analytics vs data science salary discussions, because they usually reflect a wider gap in required depth as well.
How to choose the right qualification path
There is no single correct path into analytics. A bachelor’s degree is often preferred, especially in statistics, mathematics, economics, business, computer science, or another quantitative field, but employers may also accept certificates, boot camps, equivalent experience, or internships. The useful question is not “Which path is best?” but “Which path closes my gaps fastest?”
If you already have a degree
If your degree is quantitative, you may not need another full credential. You may need projects, SQL practice, and a portfolio that proves applied skill. If your degree is non-quantitative, a focused certificate or practical course can help translate your background into analyst-ready evidence.
If you have limited time and need structure
A certificate or boot camp can work well when you need deadlines, guided projects, and a curriculum that covers SQL, spreadsheets, statistics, and dashboards. This is often the best route for career changers who struggle to build a coherent plan alone. When evaluating programs, look for project quality and tool coverage rather than brand promises, and compare them with recognized data analytics certifications to check whether the credential supports the kind of jobs you want.
If budget is tight and you are self-directed
Self-teaching is realistic for entry level data analytics jobs if you can produce credible work samples. In practice, self-taught candidates fail less from lack of talent than from lack of proof. If you choose this route, build a syllabus around SQL, Excel, one dashboard tool, and one small Python workflow, then turn that learning into portfolio projects. A structured option such as a Free Online Data Science Bootcamp can be useful if you want direction without committing to a formal program.

How many portfolio projects are enough, and what should they show?
For most entry-level applicants, three strong projects are enough. Two can work if they are unusually complete. Six weak projects usually hurt more than they help.
The persuasive projects are not the ones with the fanciest charts. They are the ones that show the full analyst workflow and a clear business question. A hiring manager should be able to see your data cleaning decisions, SQL logic, metric definitions, dashboard design, and final recommendation without guessing. If you want to understand the support side of analytics work too, reading a data support engineer job description can sharpen your sense of how much operational discipline employers value alongside analysis.
- One business KPI project: a dashboard tracking revenue, conversion, churn, or operational performance.
- One messy data cleaning project: duplicates, missing values, inconsistent categories, and documented decisions.
- One decision-focused analysis: a pricing, campaign, retention, staffing, or process question with a recommendation.
Industry relevance helps, but only if it is real. A marketing analytics project should use campaign, funnel, or conversion metrics. An operations project should focus on throughput, fulfillment, delays, or utilization. Generic projects with no business framing look like coursework. Specific projects look like job readiness.
Which qualifications matter most by analytics track?
This is where many articles stay too general. Different entry-level analytics tracks reward different strengths. The common baseline still matters, but the emphasis changes.
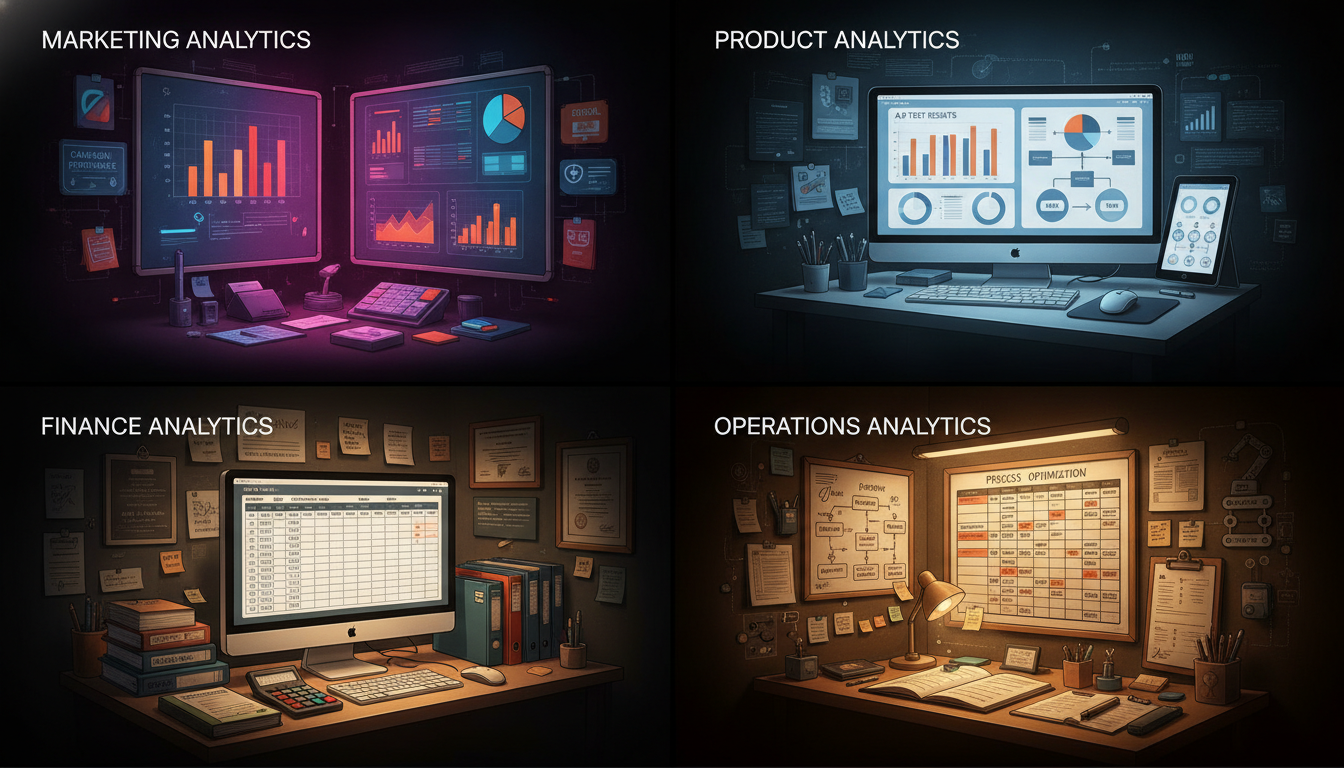
Marketing analytics
Prioritize spreadsheet fluency, SQL, dashboarding, and comfort with campaign metrics such as conversion rate, click behavior, and acquisition performance. Communication matters a lot because findings often need to be explained to marketers who move fast and want clear recommendations.
Product analytics
Prioritize SQL, event-style thinking, experimentation concepts, and metric definition. Basic A/B testing knowledge can matter here more than in other junior tracks. Product teams care less about decorative dashboards and more about whether you can define activation, retention, and feature usage clearly.
Finance analytics
Prioritize Excel, accuracy, reconciliation habits, and comfort with structured reporting. SQL still matters, but precision matters even more. Finance-facing teams often value fewer flashy projects and more evidence that you can work carefully with numbers that affect planning and reporting.
Operations analytics
Prioritize Excel, SQL, process reasoning, and practical problem-solving. Good operations analysts can connect data to staffing, delivery, inventory, scheduling, or service quality. Domain understanding often gives candidates an edge here, even if their Python for data analysis is modest.
What counts as experience when you have no analytics job yet?
Professional experience is helpful, but not the only valid proof. Internships, co-ops, volunteer projects, campus research, and project-based work all count if they show genuine analysis. The key is whether you can explain the problem, your method, and the result.
Do not undersell adjacent experience. If you improved a spreadsheet process, built a dashboard for a student group, cleaned CRM exports for a small business, or supported reporting in another role, that is relevant. Frame it in analyst language: source, clean, analyze, visualize, recommend.
A practical filter for deciding what to apply for this week
You do not need to qualify for every analytics job. You need a repeatable rule for spotting the right ones fast.
- Apply if you match about 70% of the core tools, especially SQL and spreadsheets.
- Prioritize roles with reporting, dashboarding, KPI analysis, or operational analysis in the description.
- Be cautious if the posting emphasizes machine learning, production engineering, or deep statistical modeling.
- Tailor one portfolio project to the job’s domain before applying.
- Use your resume bullets to show outcomes, not just tool names.
Why some applicants with decent skills still miss interviews
The usual problem is not missing one tool. It is presenting skills as a list instead of as evidence. “SQL, Excel, Tableau, Python” says very little. “Queried order data with SQL, cleaned duplicate records, built a Power BI dashboard, and identified delay drivers” says much more.
For entry level data analytics jobs, qualification is really about credibility. Employers need to believe you can handle messy data, basic analysis, and clear reporting with minimal supervision. If your resume, portfolio, and project explanations all point to that same story, you look hireable even without a long work history.
How to become a stronger applicant for entry level data analytics jobs
The fastest path is usually narrower than people expect. Pick one target track, build three serious projects, and make sure every project proves SQL, spreadsheet work, visualization, and business reasoning. Add Python if your target roles commonly mention it, but do not hide weak fundamentals behind code.
Most readers do not need another credential before they apply. They need clearer evidence. If your current background already covers the basics, spend the next month improving your portfolio, sharpening project explanations, and targeting titles that genuinely match junior-level work. That is often the difference between “still learning” and “ready for interviews.”