Data analytics vs data science salary: what to expect at each level

Data science generally offers higher salaries than data analytics, with a median U.S. pay of $152,000 versus $126,000, but requires stronger technical skills in Python, statistics, and modeling. Data analytics provides a faster, more accessible entry point using SQL, Excel, and BI tools, focusing on business reporting and decision support. Salary growth in analytics depends on domain expertise and stakeholder influence, while data science rewards advanced skills in predictive modeling, experimentation, and machine learning, especially at senior levels. Entry-level data science roles often demand graduate-level knowledge, making them harder to access initially. Mid to senior data scientists typically command higher pay due to their impact on product, automation, and strategic business decisions. However, some analyst roles in high-impact domains can out-earn less technical data scientist roles. Choosing between the two depends on your current skills, career goals, and preferred work style. If you have strong coding and statistical abilities and enjoy modeling, data science offers greater long-term pay and technical growth. If you seek quicker entry, prefer business-facing roles, or want steady income momentum, data analytics is a practical starting point. Ultimately, the best choice aligns with your skills, interests, and income timeline rather than salary alone.


Data Science Consulting Services vs Data Science as a Service: Key Differences, Costs, and Use Cases

Data science consulting services and Data Science as a Service (DSaaS) serve distinct business needs. Consulting is ideal for unique, ambiguous problems requiring custom solutions, expert diagnosis, and short- to medium-term projects. It involves hands-on collaboration with experts to define problems, develop models, and support implementation. DSaaS, conversely, offers ongoing, repeatable analytics and machine learning capabilities through a managed, subscription-based service, best suited for known, continuous operational needs like lead scoring or anomaly detection. Choosing between them depends on factors like problem clarity, repeatability, internal data science maturity, customization needs, and operating model preferences. Organizations with low data science maturity and clear recurring outcomes often benefit more from DSaaS, which reduces operational burdens. Consulting suits those needing problem framing before committing to a long-term approach. Clients retain governance and strategic responsibilities in both models, but DSaaS shifts more day-to-day execution to the provider. Total cost of ownership (TCO) over 6 to 12 months should consider vendor fees, internal labor, infrastructure, and risk costs. Consulting may be costlier if problems are unclear or require ongoing support, while DSaaS costs rise with poor data quality or heavy customization demands. Ultimately, consulting mitigates risks of solving the wrong problem, while DSaaS ensures consistent delivery of known solutions. Many organizations benefit from starting with consulting and transitioning to DSaaS for sustained operations.

How to Choose a Data Science Services Company for Your Business

Choosing the right data science services company is about finding a partner who can deliver end-to-end solutions—from problem framing to deployment and ongoing model management—rather than just technical prowess. With nearly half of AI projects failing to reach production, prioritize vendors that demonstrate production maturity, business fit, delivery depth, team compatibility, and clear commercial terms. Define your engagement type first: short pilots for validation, consulting for strategy, or long-term partnerships for continuous delivery. During initial calls, ask targeted questions about data access, use case evaluation, deployment responsibilities, and past challenges to gauge vendor competence. Beware of red flags like narrow focus on accuracy, poor team collaboration, weak data governance, unclear proof of work, and vague ownership terms. Use a scorecard to evaluate domain expertise, technical skills, MLOps maturity, communication, security, and pricing aligned with your bottlenecks. Match your choice to your needs: strategy consultancies for fuzzy problems, build-and-deploy firms for clear use cases, and long-term partners for repeatable delivery. Narrow your vendor list to three, validate with pilots or consulting as appropriate, and select the company capable of balancing business insight, technical execution, and operational discipline to ensure AI projects succeed beyond prototypes.

Choosing Between Data Science and Analytics for Your Career Goals

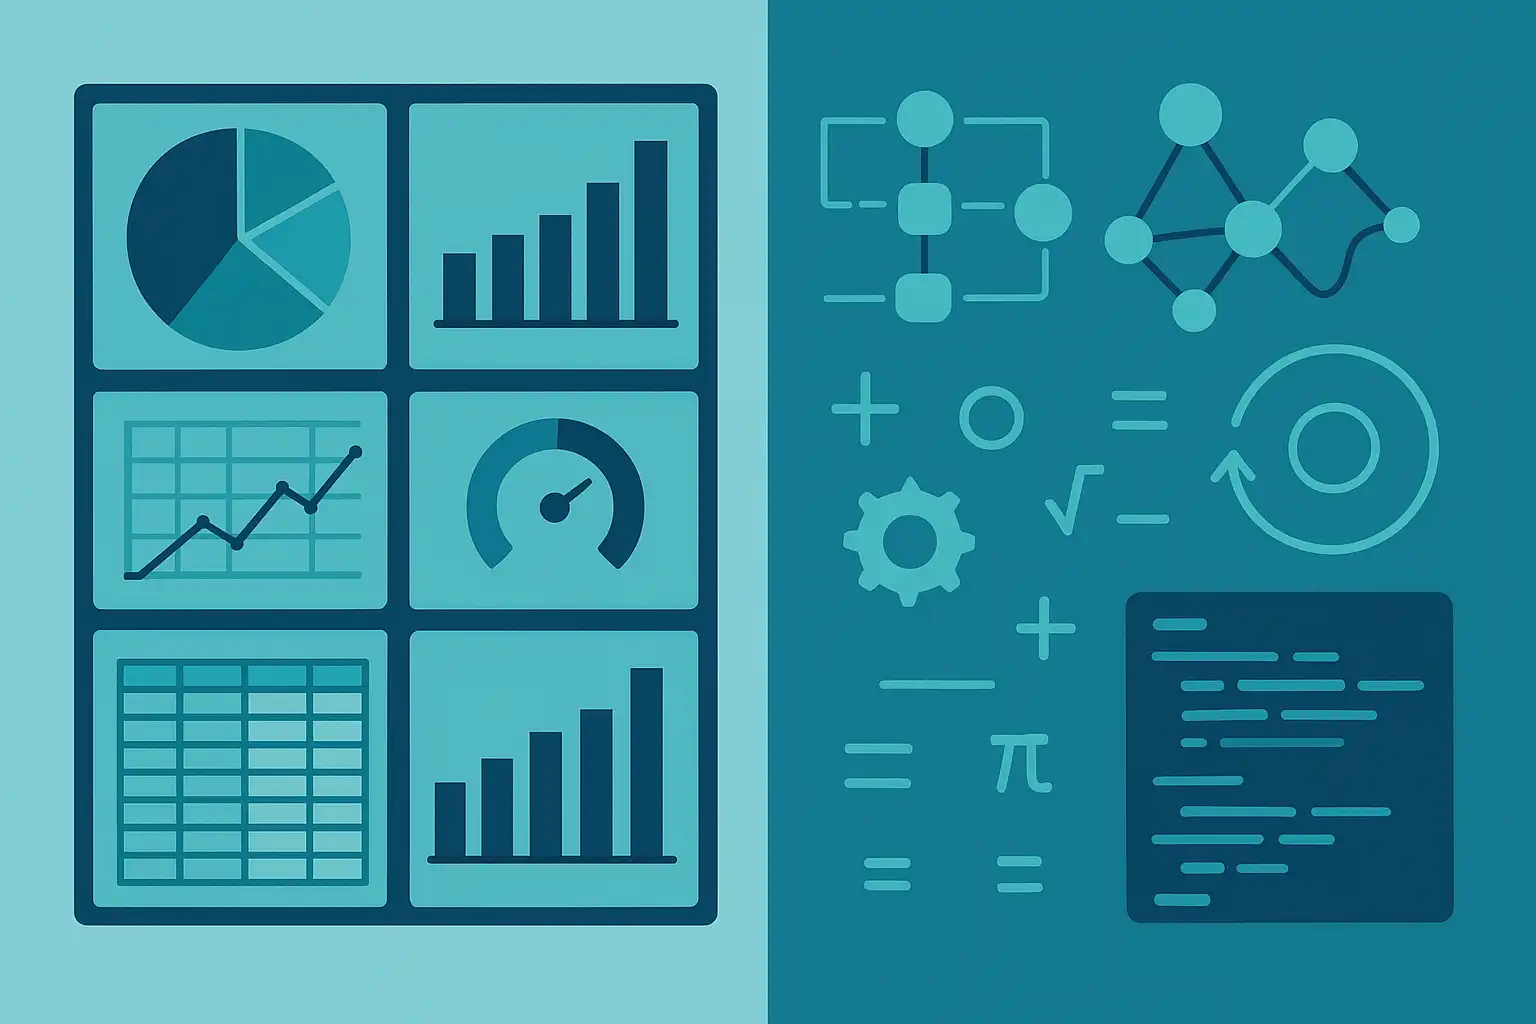
Choosing between data science and data analytics depends on your career goals, skills, and work preferences. Data analytics focuses on examining existing data to support business decisions through dashboards, reports, and KPI tracking, requiring moderate coding skills mainly in SQL and spreadsheets. It suits those who prefer clear, business-oriented problems and faster feedback. Data science involves building predictive models and algorithms, demanding stronger coding skills in Python or R, deeper math, and experimentation, ideal for those who enjoy abstraction and technical challenges. Beginners should start with a shared foundation in SQL, spreadsheets, basic statistics, data cleaning, and visualization to keep both paths open. Entry-level roles in analytics include junior data analyst and business analyst, offering faster access to business-facing work, while data science often requires advanced technical preparation and evolves from analyst roles to predictive modeling responsibilities. The best choice hinges on whether you prefer explaining data for human understanding (analytics) or creating models to predict outcomes (science). For most newcomers, starting in data analytics provides practical experience and transferable skills, making it a smart first step before potentially transitioning to data science. Choose data science only if you are comfortable with coding, statistical modeling, and experimentation. Both careers are valuable but cater to different problem-solving styles and technical demands.

Should you learn data analytics or data science first?

Choosing between data analytics and data science depends on your background and career goals. Beginners should start with data analytics, which focuses on examining existing data to identify trends and insights using tools like Excel, SQL, and Tableau. It requires less complex math and coding, making it an accessible entry point that builds a strong foundation for transitioning into data science. Data science encompasses analytics but adds advanced skills like programming (Python, R), machine learning, predictive modeling, and handling big data with technologies such as Hadoop and Spark. While data science offers broader and more senior career opportunities, it demands stronger technical expertise and a steeper learning curve. Key skills for analytics include data visualization, SQL, and basic statistics, whereas data science requires advanced math, programming, and experience with machine learning frameworks. Many professionals start in analytics and progress to data science by gradually acquiring programming and statistical skills. Ultimately, your choice should align with your interests—whether solving business problems or developing AI-driven solutions—and your readiness for technical challenges. Continuous learning and practical experience are essential for success in both fields. Starting with data analytics provides a practical, career-friendly path with ample job opportunities and a smoother progression into data science roles.

Data analytics vs data engineering: choosing roles for your org

Data analytics and data engineering play complementary but distinct roles in building a data-driven organization. Data engineers focus on designing, building, and maintaining scalable data infrastructures and pipelines, ensuring data quality, accessibility, and integration. They use tools like Hadoop, Spark, and cloud platforms to manage big data and ETL processes. Data analysts, on the other hand, transform this clean, reliable data into actionable insights through analysis, visualization, and reporting, using tools such as Python, SQL, Power BI, and Tableau. Hiring priorities depend on your organization’s data maturity: early-stage companies should invest in data engineering to establish a solid data foundation, while mature organizations with stable pipelines benefit more from analysts who extract business value from data. Successful teams promote collaboration between both roles, recognizing their interdependence. Industries like retail, healthcare, and manufacturing leverage these roles to optimize operations and gain competitive advantages. As data demands grow with AI, IoT, and cloud technologies, these roles will become more specialized. Avoid common pitfalls by balancing investments—ensure robust data infrastructure before expanding analytics capabilities. Measuring success involves tracking data reliability and integration for engineers, and actionable business impact for analysts. Building the right mix of data engineering and analytics talent is key to driving informed decisions and long-term business growth.

Data analytics vs statistics: how methods and goals differ

Data analytics and statistics both extract insights from data but differ in methods and goals. Data analytics emphasizes rapid exploration of large datasets to identify trends, patterns, and actionable business insights, focusing on questions like “What’s happening?” and “What will happen next?” In contrast, statistics applies scientific rigor to validate these findings through hypothesis testing, confidence intervals, and experimental design, ensuring results are reliable and not due to chance. Analytics uses modern computing tools such as machine learning and data visualization for quick decision-making, while statistics relies on mathematical models to confirm significance and avoid errors like confusing correlation with causation. In practice, analytics helps organizations respond swiftly to market changes, while statistics provides depth and certainty, crucial for high-stakes decisions in healthcare, finance, and research. Teams often collaborate, with analysts generating hypotheses and statisticians validating them, combining speed with accuracy. Choosing between the two depends on organizational needs, but integrating both enhances decision-making quality and business agility. Tools range from Tableau and Python in analytics to SPSS and Stata in statistics. Ultimately, the synergy of data analytics and statistics empowers businesses to innovate confidently and stay competitive.

A practical data analytics lifecycle for teams building repeatable reporting

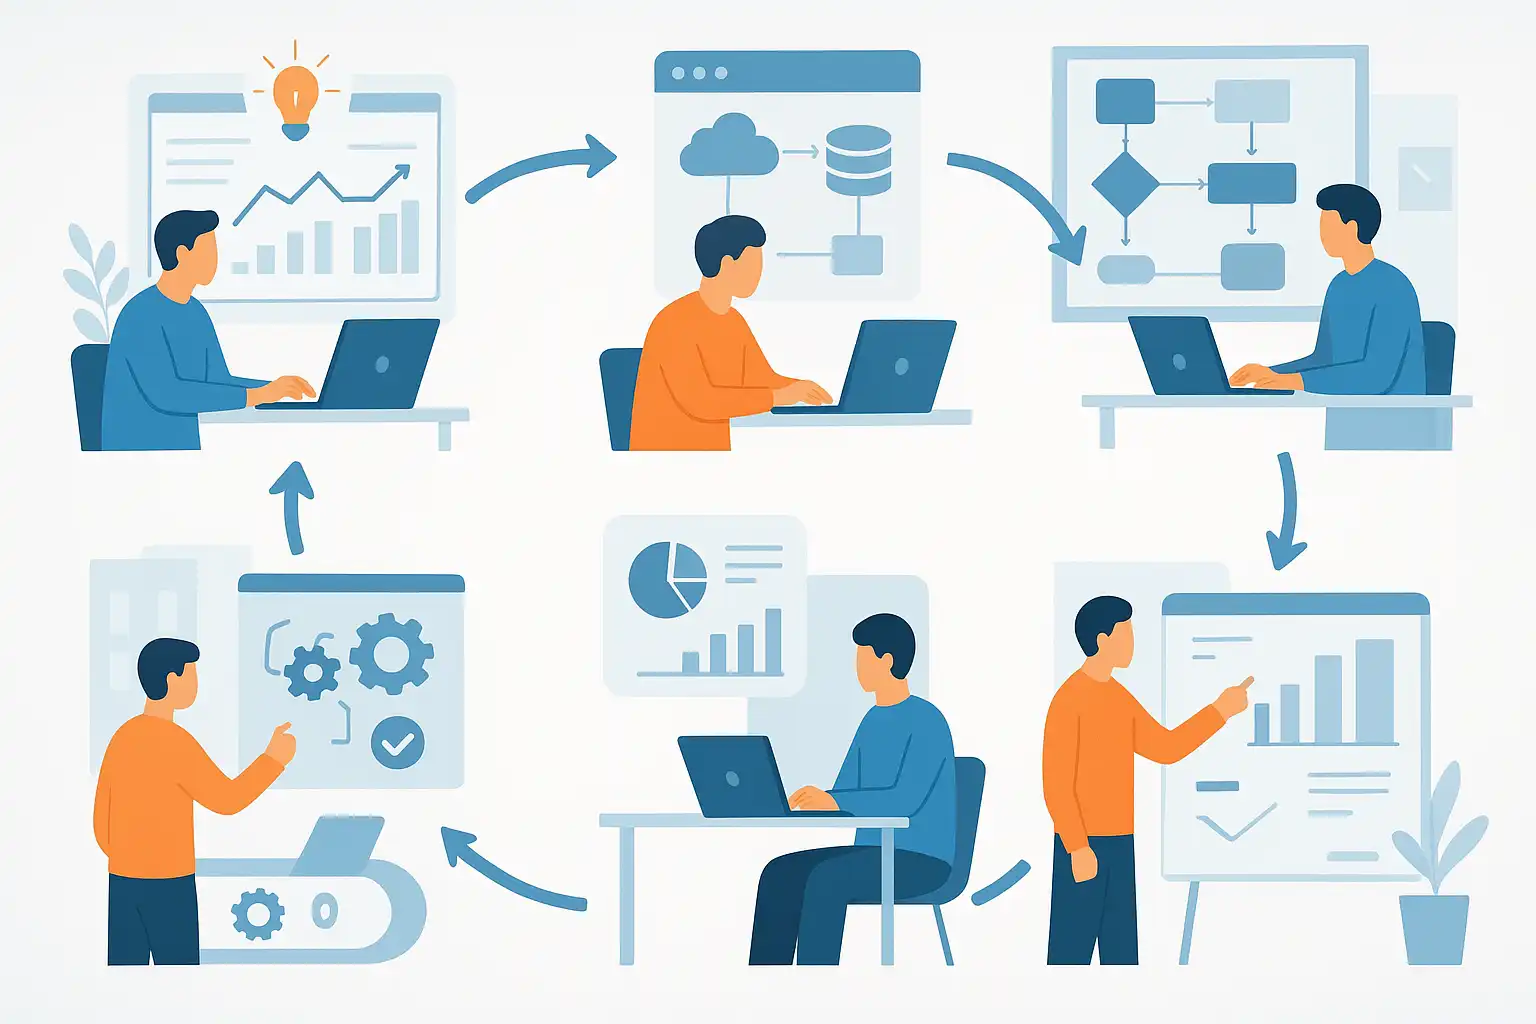
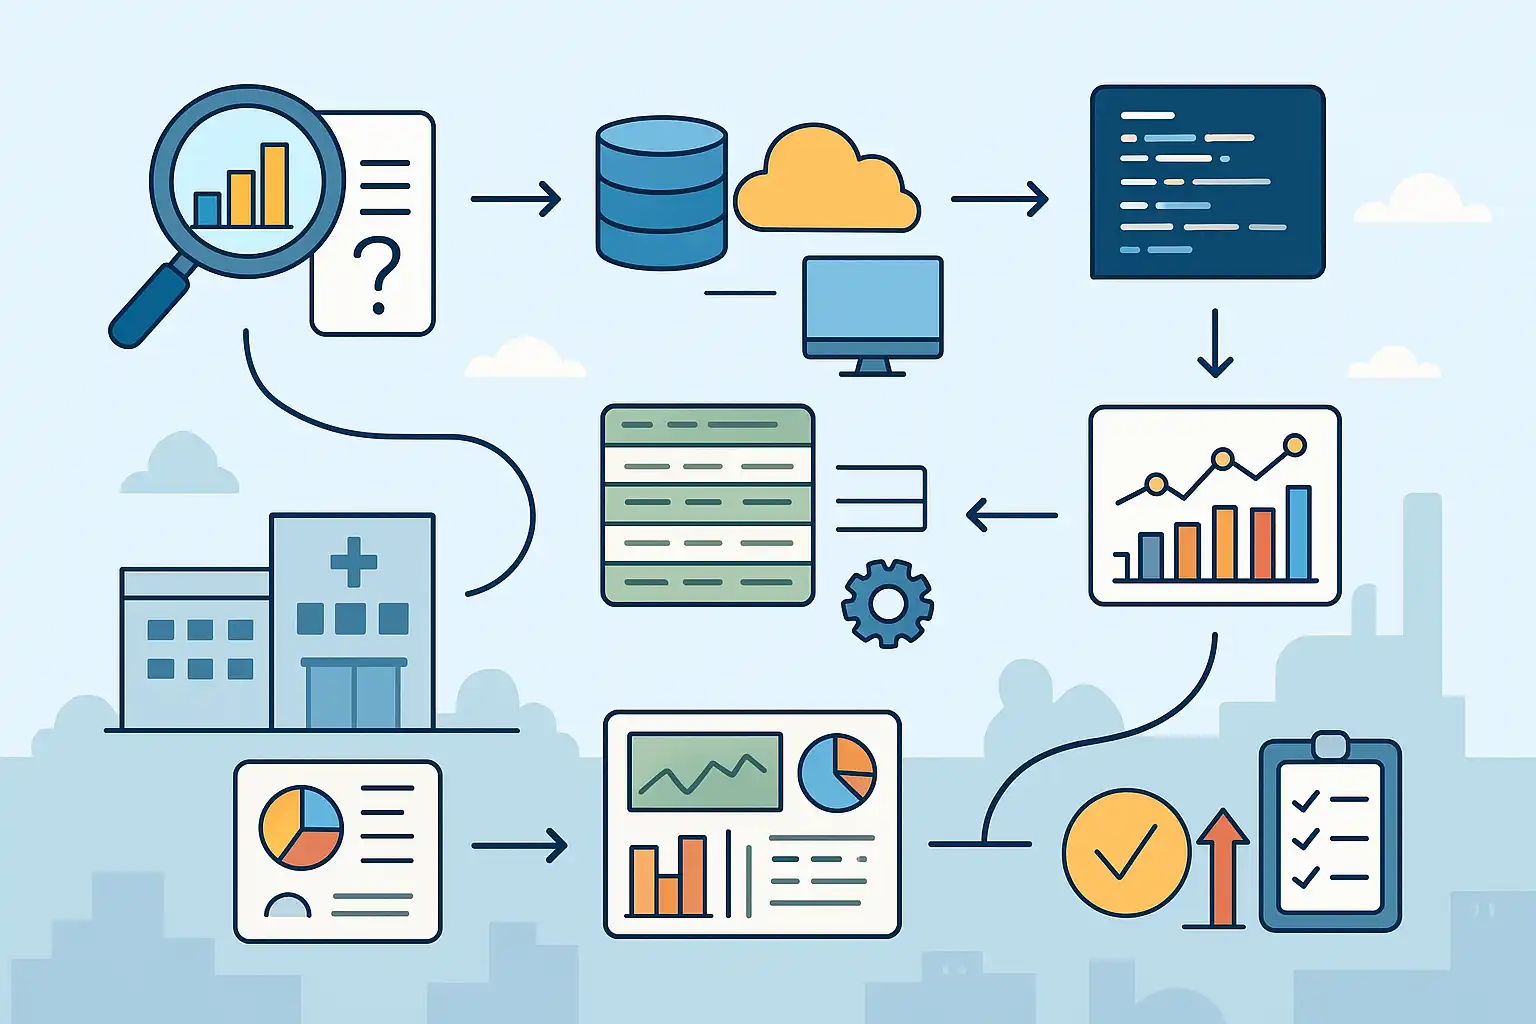
A practical data analytics lifecycle is vital for teams aiming to build accurate, reliable, and repeatable reports that support data-driven decisions. This lifecycle consists of six key stages: discovering the problem, preparing data, planning the model, building the model, communicating results, and operationalizing the process. Each phase ensures clarity, reduces errors, and enhances collaboration by standardizing workflows and automating repetitive tasks. Utilizing collaborative tools like version control, automated pipelines, and visualization software streamlines teamwork and improves report quality. To maintain accuracy and consistency, teams should define clear objectives, perform rigorous data quality checks, standardize processes, continuously validate models, communicate effectively, and monitor deployed models regularly. Automation and comprehensive documentation further boost efficiency and reliability. Regular reviews and updates of the lifecycle ensure alignment with evolving business needs. Essential roles include data analysts, data engineers, and business stakeholders, all working together for meaningful insights. This structured approach benefits teams of all sizes by fostering consistent, scalable, and high-quality reporting, ultimately saving time and enhancing decision-making capabilities.

Types of data analytics and when each one fits

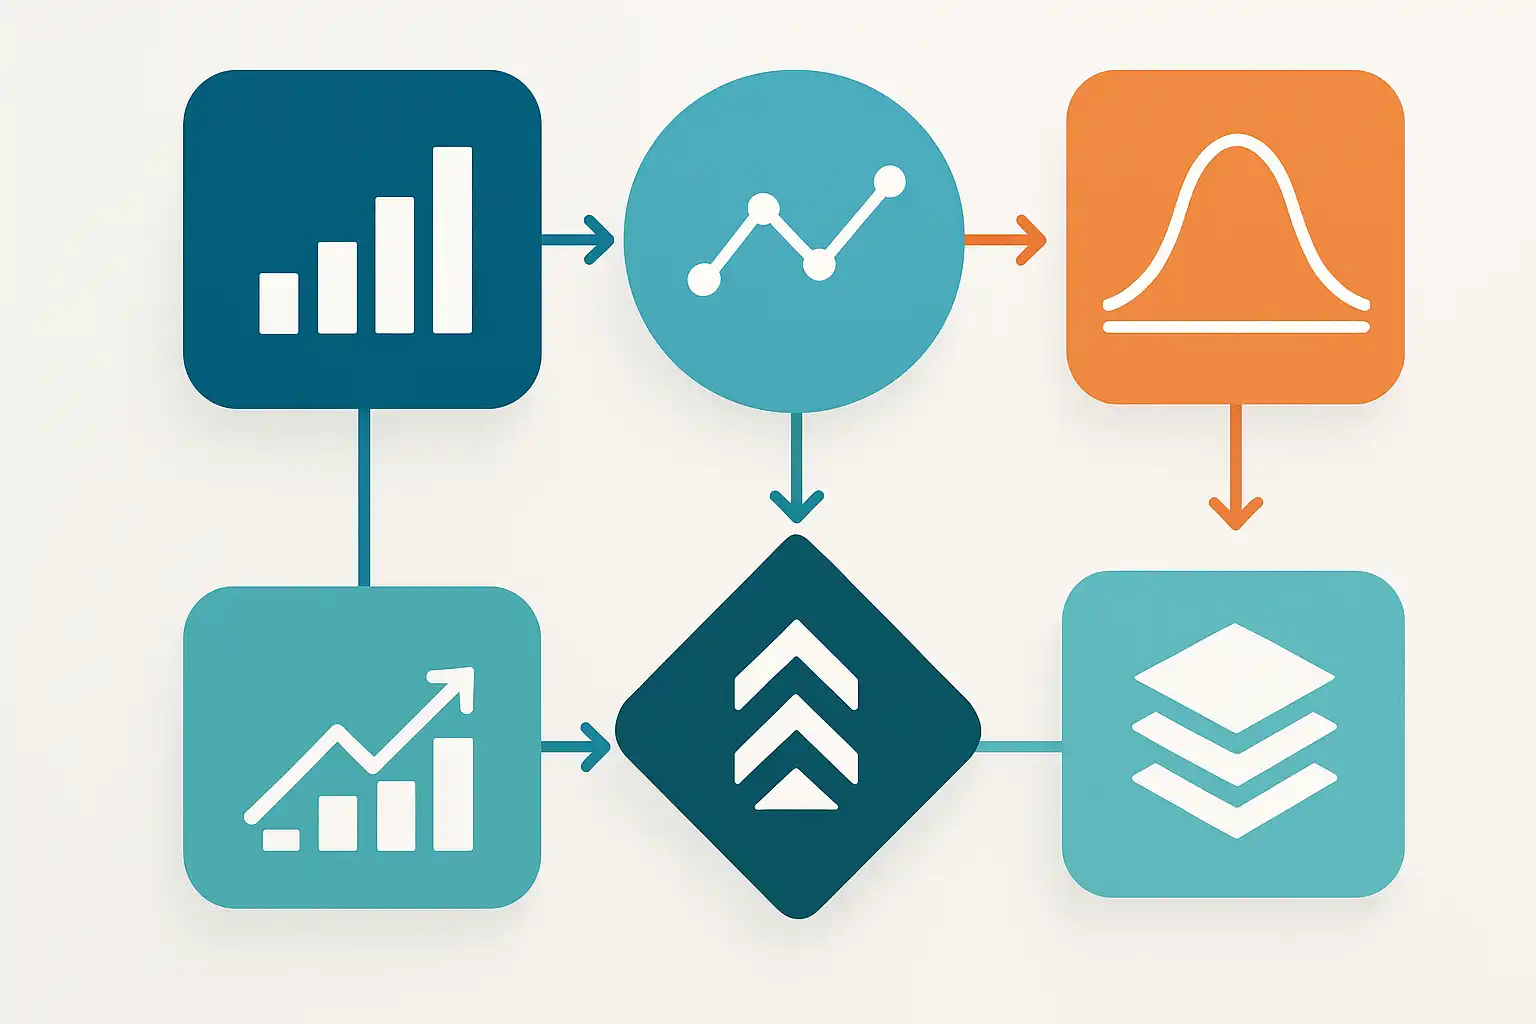
This guide explains the four key types of data analytics—descriptive, diagnostic, predictive, and prescriptive—and their roles in enhancing business decisions. Descriptive analytics summarizes historical data to reveal what happened, using reports and dashboards. Diagnostic analytics investigates why events occurred, employing statistical tests to identify causes. Predictive analytics forecasts future outcomes through models like machine learning, aiding in planning and risk management. Prescriptive analytics recommends optimal actions based on predictions, using optimization and simulations. Businesses often combine these analytics sequentially to gain comprehensive insights, starting from understanding past trends to making data-driven decisions. Each type has distinct tools and benefits: descriptive analytics is quick and simple; diagnostic uncovers root causes; predictive supports forecasting but requires quality data; prescriptive offers actionable advice but demands expertise. Companies should select analytics methods based on their goals, data readiness, and resources, starting simple and scaling complexity as needed. Key considerations include data quality, privacy, clear communication, and ongoing maintenance. Both small and large businesses can leverage these analytics types to improve performance, optimize operations, and drive growth by aligning analytics strategies with their specific needs and capabilities.

The data analytics process from raw data to decisions

The data analytics process transforms raw data into actionable business decisions through six key steps: defining the problem, collecting data, cleaning and preparing data, analyzing, visualizing results, and interpreting findings for decision-making. Defining a clear problem guides the entire process, while thorough data collection and meticulous cleaning ensure accuracy and reliability. Data analysis uncovers trends and insights, which are then communicated effectively through visualizations like charts and dashboards. This enables stakeholders to make informed decisions and monitor outcomes, creating a feedback loop for continuous improvement. Common challenges include data accessibility, quality issues, siloed teams, and complex analysis, which can be overcome with user-friendly tools, training, and collaboration. The process applies across industries such as retail, healthcare, finance, manufacturing, and small businesses, each tailoring tools and goals to their needs. Best practices emphasize consistent data cleaning using tools like Python or R and clear visualization to simplify complex insights. Ultimately, this structured approach empowers organizations of all sizes to leverage data effectively, turning information into strategic actions that drive growth and efficiency.