
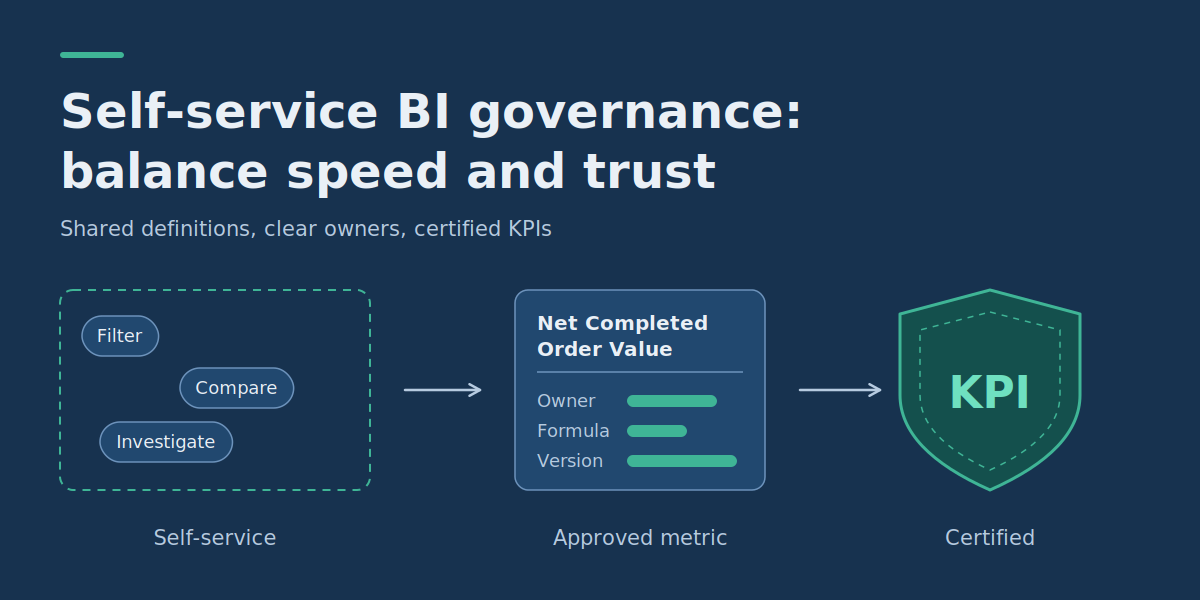
Self-Service BI vs Governed Analytics: How to Balance Speed and Trust
What Matters Most About Self-Service BI Governance?
- Self-service and governance are not opposites. Business teams can explore data independently while sharing approved metric definitions, access policies and trusted datasets.
- Govern definitions, not every question. Central teams control critical metrics and sensitive data. Analysts stay free to filter, compare and investigate authorized information.
- Assign ownership before certification. Every official KPI needs a business owner, an implemented calculation, validation evidence and an accountable certification decision.
- Use different controls for different reporting risks. A personal exploratory dashboard doesn’t need the same approval as a company-wide financial report.
- Measure governance by adoption and reliability. A successful approach reduces conflicting metrics and unsafe sharing without sending every request through a central queue.
The self-service BI vs governed analytics debate is really about one problem. Business teams need fast answers, but independently built reports can produce conflicting numbers, inconsistent definitions and inappropriate access to sensitive data. The answer is not to choose between unrestricted self-service and centrally controlled reporting. It is to build a governed reporting foundation where authorized users explore freely without redefining official business metrics.
For data platform leads, the practical challenge is deciding where business users get autonomy and where consistent rules are mandatory. A useful operating model combines shared metric definitions, clear ownership, proportionate permissions, certified assets and gradual adoption. If you are still shaping the wider programme, start with your data governance strategy, because it sets the compliance and trust goals that the rules below should serve.
Self-Service BI vs Governed Analytics: What Is the Difference?
Self-service business intelligence (BI) lets business users create reports, explore datasets and answer questions without a technical team handling every request. Governed analytics sets the definitions, ownership, quality standards and access controls that make reporting reliable and appropriate for its use. The difference is how reporting decisions are made, not which software you buy.
| Dimension | Unrestricted self-service BI | Centrally governed reporting | Governed self-service BI |
|---|---|---|---|
| Report creation | Users create reports independently. | Central teams build and publish approved reports. | Users build from authorized, reusable data models. |
| Metric definitions | Calculations may differ between reports. | Definitions are maintained centrally. | Shared metrics are defined centrally; users control how they analyze them. |
| Access control | Often depends on individual report creators. | Permissions follow centrally managed policies. | Permissions are enforced while users explore and create. |
| Speed of exploration | High, if users have suitable access. | Limited by central team capacity. | High for supported datasets and approved use cases. |
| Trust and reuse | Depends on each creator’s validation. | Established through controlled development and review. | Supported by certified sources, clear ownership and review of widely shared assets. |
| Main risk | Inconsistent results, duplicated work, unsafe sharing. | Slow delivery, backlogs and unofficial workarounds. | Weak enforcement or overcomplicated processes. |
For many organizations, governed self-service is the best default: keep critical definitions and access rules consistent, and let teams answer their own questions inside those boundaries.
Microsoft’s guidance supports this balance. Its Fabric adoption roadmap on governance says governance should balance user empowerment, regulatory compliance and internal requirements, and that the right balance differs between organizations and even between business units. It also notes that the real focus of governance is what users do with data, not the data itself.
Where Self-Service Analytics Goes Wrong
Self-service gets hard to manage when its flexibility reaches decisions that should be shared across the organization.
Different Departments Calculate the Same KPI Differently
A commercial team reports monthly revenue from completed orders. Finance subtracts refunds and excludes some transactions. Both reports are internally consistent, yet managers get two answers to a question they believe has one definition.
This is usually not a visualization problem. The reports use different calculation rules, reporting dates or data sources. Decide which measure is the official KPI, document its scope and let users analyze it across relevant dimensions. Department-specific measures can stay available if they have distinct names and aren’t presented as interchangeable with the approved KPI.
Report Creators Receive More Data Access Than They Need
An analyst who only needs sales by product category may get customer-level records because the platform was configured for convenience. Hiding a filter on a dashboard also doesn’t restrict what users can reach through the underlying model, an API, an export or another report.
Governance must separate what a user can view, query, modify, export and share. Sensitive fields shouldn’t become available just because someone can create a chart.
Every Team Creates Another Version of the Same Dataset
When users can’t find a trusted source, they copy data into spreadsheets or publish new extracts. Over time, several versions of the same logic become impossible to reconcile.
Not every duplicate is harmful, and temporary analysis often has a legitimate purpose. The problem starts when an experimental dataset becomes a permanent dependency for business decisions without ownership, refresh rules or validation. Make trusted datasets easy to find, explain their intended uses and give teams a clear path to promote useful departmental models into supported assets.
Centralized Approval Becomes a Reporting Bottleneck
The opposite failure is a data team that must approve every filter, chart change or exploratory question. That discourages responsible self-service and pushes teams toward unofficial solutions outside the platform.
Microsoft describes the same dynamic: heavy up-front control tends to encourage poor habits and workarounds, and its guidance recommends that the answer to new data requests be “yes, and” with clear rules rather than a default “no”. Review changes by impact. Changing the layout of a personal chart should not need the same approval as changing the official definition of company revenue.
Which Analytics Decisions Should Be Governed?
A practical governance model separates exploratory work from authoritative reporting. Microsoft’s guidance points the same way: governance requirements depend on who owns the content, how widely it is delivered, how sensitive the data is, and whether the content is critical. The table below turns those factors into a starting policy.
| Reporting activity | User autonomy | Required controls | Publishing decision |
|---|---|---|---|
| Personal exploration of approved data | Users filter, visualize and experiment independently. | Existing access permissions, dataset usage rules and sensible query limits. | No formal certification needed. |
| Departmental operational dashboard | Team analysts develop and maintain reports. | Named owner, documented measures, authorized audience and basic validation. | Department owner approves wider team sharing. |
| Company-wide executive KPI | Users explore approved metrics but cannot silently replace official definitions. | Business definition approval, technical validation, access review and versioned documentation. | Authorized governance reviewer certifies after required sign-offs. |
| Sensitive or restricted reporting | Limited to specifically authorized users and permitted operations. | Classification, least-privilege access, security testing and applicable organizational requirements. | Security approval plus any required business or compliance authorization. |
This is a proposed operating policy, not an industry standard. An organization with regulated financial or healthcare data may need stricter controls. A small team using only non-sensitive operational data may need less. The principle stays the same: apply more review as the consequence of a wrong or exposed result grows.
Before using the table, inventory your existing reports. Assign each a usage category, identify its owner and record whether it relies on an approved metric. Start with reports that drive significant cross-department decisions rather than trying to certify every personal dashboard. Microsoft’s guidance puts it simply: you can’t govern what you don’t know about, so inventory comes first.
Use a Common Metrics Layer to Keep Definitions Consistent
A shared metrics layer separates business calculations from individual reports. Instead of rebuilding the same KPI in several dashboards, the organization defines its meaning and calculation once in a reusable model.
What Is a Semantic Layer in BI?
A semantic layer is a business-oriented abstraction over data. It describes concepts such as customers, orders, products, measures, dimensions and their relationships, so analytical tools apply consistent definitions without every author rebuilding the underlying logic. For example, a metric called “Net Completed Order Value” can have one documented calculation while sales managers explore it by product category, region or month.
Implementations vary: centrally defined metrics on top of data models, BI semantic models, database views or managed analytical services. A semantic layer is not a complete governance solution on its own. Metric consistency, access control, quality assurance and certification still need explicit implementation and ownership.
Worked Example: Define One Approved Business Metric
Consider a hypothetical online retailer with separate sales, marketing and operations dashboards. The teams need a shared metric for the value of completed orders after refunds. The organization names it Net Completed Order Value rather than “revenue”, to avoid presenting an operational sales measure as an accounting revenue-recognition measure.
| Field | Approved definition |
|---|---|
| Metric ID | net_completed_order_value |
| Business meaning | Value of completed orders after associated customer refunds. |
| Calculation | Sum of completed order values, excluding tax and shipping, minus refunds associated with those orders. |
| Inclusions | Completed orders within the reporting period. |
| Exclusions | Cancelled, pending and failed orders; tax and shipping charges. |
| Time allocation | Attribute the order to its completion month. Attribute later refunds back to the original order month. |
| Currency | USD only for the initial implementation. Multi-currency needs a separately approved conversion policy. |
| Dimensions | Completion month, product category and permitted sales region. |
| Freshness requirement | Daily refresh, with the last successful update displayed. |
| Business owner | Commerce Operations Lead. |
| Technical owner | Analytics Engineering Lead. |
| Definition version | 1.0, proposed for certification. |
The values and roles here are illustrative. What matters is that a metric definition explains how the number is calculated, not just what it is called.
Validate the Metric Against a Small Known Dataset
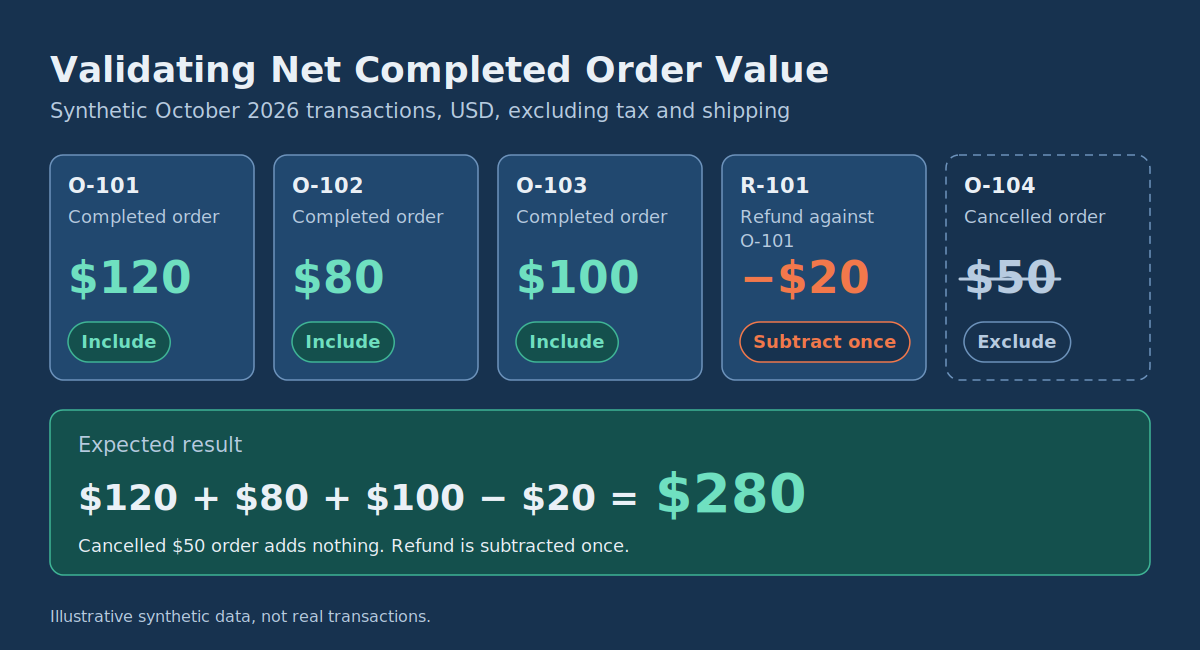
Assume these synthetic transactions all relate to orders completed or cancelled in October 2026. Amounts are in USD and exclude tax and shipping.
| Record | Event | Amount | Treatment |
|---|---|---|---|
| O-101 | Completed order | $120 | Include |
| O-102 | Completed order | $80 | Include |
| O-103 | Completed order | $100 | Include |
| O-104 | Cancelled order | $50 | Exclude |
| R-101 | Refund of $20 against order O-101 | -$20 | Subtract once from the original order month |
Expected result: $120 + $80 + $100 − $20 = $280.
The cancelled $50 order contributes nothing. The refund is subtracted once without removing the original order. Two analysts filtering the approved metric for October should get $280 on the same data snapshot, whichever dashboard they use.
There is a trade-off: a later refund can change the previously reported October value. If finance requires closed historical periods, it may need a separate, explicitly named metric with a different adjustment policy.
To validate a production implementation, extend the synthetic dataset with partial refunds, multiple refunds, duplicate refund records, missing timestamps and timezone boundaries. Compare expected results with actual model outputs, and reconcile an agreed sample or total against authoritative operational records. Once the calculation passes, analysts can build charts and comparisons freely without reimplementing refund logic in every report.
Who Owns Metrics, Permissions and Certification?
A governed self-service model needs explicit accountability. Without it, the data team is expected to decide business definitions while business departments assume engineering owns every discrepancy.
Microsoft’s guidance makes the same point: define roles and responsibilities clearly, and make sure someone has enough influence over data governance decisions to enforce them across organizational boundaries. The matrix below assigns one accountable role to each major decision. It suits a medium-sized organization; a smaller business can give several responsibilities to one person as long as approval and security requirements are still met.
Practical BI Governance Ownership Matrix
| Decision or activity | Accountable owner | Implementation responsibility | Required review or input | Evidence of completion |
|---|---|---|---|---|
| Define KPI meaning | Commerce Operations Lead | Business analyst documents calculation rules. | Finance and affected business teams. | Approved metric definition with inclusions and exclusions. |
| Maintain source data quality | Data Platform Lead | Data engineer implements ingestion and validation checks. | Source-system owner and metric owner. | Data-quality checks, source mapping and identified exceptions. |
| Implement shared metric | Analytics Engineering Lead | Analytics engineer builds and tests the model. | Business metric owner. | Versioned calculation, test cases and reconciliation results. |
| Approve sensitive data access | Information Security Owner | Platform or identity administrator configures permissions. | Data owner and any required compliance representative. | Documented access policy and verified authorization tests. |
| Grant official certification | BI Governance Lead | Authorized BI administrator applies the certification status. | Business metric owner, technical owner and security owner where required. | Recorded approvals, validated metric version and certification entry. |
| Publish a departmental dashboard | Department Reporting Lead | Department analyst builds and maintains the report. | Metric owner if official definitions are used or modified. | Named report owner, audience, dependencies and validation notes. |
| Approve changes to official KPI definitions | Business metric owner | Analytics engineer implements the approved change. | Governance lead and affected reporting teams. | New version, impact analysis and updated validation results. |
The matrix deliberately separates business correctness from technical implementation. A data engineer can verify that a query returns the expected result, but the business owner decides whether the definition suits its purpose. Likewise, the person who approves a business metric is not automatically the person authorized to certify it or grant sensitive-data access.
Do You Need a Center of Excellence?
Not necessarily a formal one. Microsoft describes a Center of Excellence (COE) as an internal team of technical and business experts who actively help others work with data. Having it formally shown on the organizational chart is recommended but not required; what matters most is that its roles and responsibilities are identified, prioritized and assigned. One of its goals is to maximize the benefits of self-service BI while reducing the risks.
Structure matters too. Microsoft notes that a highly centralized COE can drift toward one-size-fits-all decisions, while a highly decentralized one tends to become siloed, and that unified or federated models work best for most organizations. See the full guidance on the Center of Excellence.
To define who does what across data engineering, reporting and analytics operations, see DataColab’s guide to business intelligence team roles.
A Complete Workflow for Certifying a Business Metric
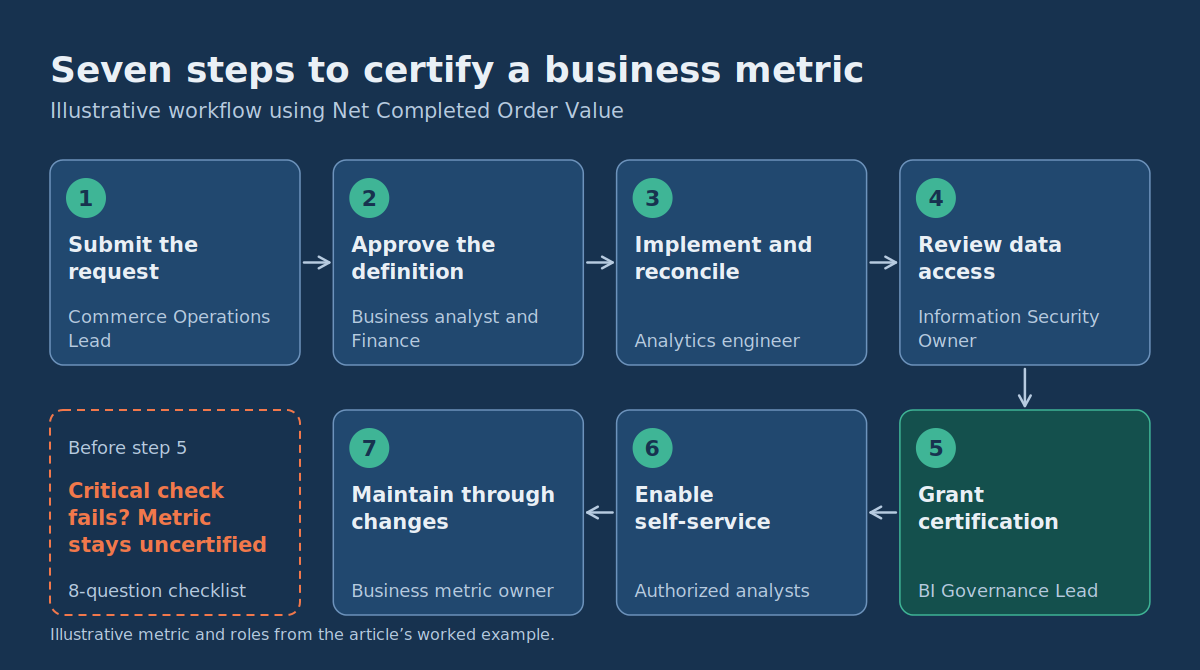
Certification should show that an approved reviewer has evaluated a metric or reporting asset against documented standards. It should not become a decorative label on a popular dashboard. Microsoft lists typical certification requirements: data accuracy validation, source and lineage review, technical review of the data model, security review and documentation review.
The workflow below uses the illustrative Net Completed Order Value metric and the ownership matrix above. It fits an existing ticketing system, documentation repository and BI platform without a new governance application.
Step 1: Submit the Metric Request
The Commerce Operations Lead requests one company-wide definition of Net Completed Order Value, because sales and operations dashboards need a common value for completed orders after refunds. Record the metric name, business question, intended audiences, business owner and current source systems.
Output: A metric request assigned to a named owner, with a clear reason for standardization.
Step 2: Approve the Business Definition
The business analyst prepares the metric contract shown earlier. Commerce Operations and Finance review how completed orders, refunds, cancellations and historical adjustments are handled. Ambiguities must be resolved before the calculation becomes official. For example, whether a refund changes the original order month or appears only in the refund month is a business policy decision, not something for individual report creators to settle.
Output: Version 1.0 of the definition, approved by the business owner and reviewed by affected teams.
Step 3: Implement and Reconcile the Calculation
The analytics engineer implements the calculation in the shared reporting model. Validation includes:
- The synthetic sample returns exactly $280.
- Cancelled and pending orders are excluded.
- Refunds are attributed to the correct original orders.
- Duplicate source records don’t cause double counting.
- Dimension subtotals reconcile with the overall total.
- The calculation uses the approved time zone, currency and reporting-date rules.
The synthetic sample verifies the logic but does not prove production accuracy. Also reconcile representative production results against an agreed source of truth, investigate differences and document any permitted timing discrepancies.
Output: A versioned metric implementation, completed tests and recorded reconciliation evidence.
Step 4: Review Data Access and Usage Restrictions
The Information Security Owner confirms who may access detailed transactions, aggregated metrics and associated customer attributes. For example, regional managers may explore authorized regional totals while customer-identifying details stay restricted to a smaller group.
The test plan should cover authorized access, denied access, direct data-model queries and exports where supported. Visible dashboard filters are not proof that the underlying data is secure.
Output: An approved permission policy with successful access tests for the intended audience.
Step 5: Grant Certification and Publish the Metric
The BI Governance Lead confirms that the business definition, implementation validation and applicable access review are complete. The authorized reviewer then marks the model or reporting asset as certified using the platform’s available controls.
Many BI platforms distinguish content that is merely promoted for sharing from content certified by an authorized reviewer, and certification usually has to be enabled and restricted to designated reviewers. Check how your platform handles this. Microsoft’s guidance also lists who is allowed to certify content, and what requirements must be met first, among the key governance decisions to make.
Record the approved metric version, its owner, the approval date and the supporting evidence.
Output: A documented, discoverable certified metric or reporting asset, subject to the platform’s discovery and access controls.
Step 6: Enable Self-Service Reporting from the Certified Source
Authorized analysts use Net Completed Order Value in departmental dashboards. They can compare periods, group by permitted dimensions and build visualizations. They don’t need separate approval for each personal chart. But creating a measure with a materially different refund policy and labeling it as the same certified KPI would undermine the shared definition. Alternative definitions should be named and documented clearly and should not inherit certification automatically.
Output: Independent reporting experiences built on the same approved logic.
Step 7: Maintain the Certified Metric Through Changes
Suppose the company later adds multi-currency orders. The USD-only definition can’t safely be extended without agreeing conversion sources, rates and timing. The business owner requests a definition change, analytics engineering assesses affected calculations and dashboards, and the governance reviewer confirms that required approvals and validations are complete before the revised metric is treated as certified.
If a change alters business meaning, preserve the previous version or communicate the impact clearly. Don’t silently replace historical definitions used in decision-making.
Output: A controlled metric revision with an impact assessment and an identifiable approved version.
Certification Acceptance Checklist
Before certifying a KPI, the reviewer should be able to answer yes to each question:
- Is there a named business owner who approved the calculation?
- Are the metric’s purpose, formula, exclusions, dates and units documented?
- Has the implementation passed representative calculation tests?
- Have production results been reconciled to agreed source records?
- Are dependencies and data freshness understood?
- Have applicable access restrictions been implemented and tested?
- Is the certification decision recorded with the approved version?
- Is there a defined path for investigating errors and proposing changes?
If a critical requirement fails, the metric stays uncertified until it is fixed. Analysts can still explore suitable provisional data where policy allows, as long as it isn’t presented as an approved organizational KPI.
How Should Permissions Work in Governed Self-Service BI?
Access control must follow both the information and the operation being performed. Different responsibilities may need different access to the same underlying system.
Separate Viewing, Building and Administration
- Report consumers: view approved reports and authorized results.
- Self-service report creators: create reports and run permitted queries on designated models.
- Model developers: maintain data models, calculations and technical dependencies.
- Platform administrators: configure workspaces, integrations, security settings and operational controls.
These categories describe responsibilities, not identical permission sets across tools, so map them to your platform’s actual roles. In many platforms, a higher workspace or project role can bypass row-level filtering that applies to ordinary viewers. Test permissions with real account roles instead of assuming a filtering rule protects every user.
Consider Row-Level, Column-Level and Export Restrictions Separately
Row-level restrictions control which records a user can access. Column-level restrictions, or well-designed data models, control which attributes are available. Export and sharing policies govern how authorized information leaves the reporting interface. These controls are not interchangeable.
Microsoft’s guidance gives an example of why exports need explicit attention: rather than simply enabling or blocking an export to Excel, ask why users need the data there, what questions they are answering and what decisions they make.
Before allowing broad self-service, test at least the following:
- Can a regional analyst retrieve data belonging to another region?
- Can a user reach restricted fields through an alternative report or query interface?
- Do exported results respect the expected access policy?
- Can users grant wider access to reports than their responsibilities permit?
- Do cached results, shared links and automated reporting preserve required access controls?
Certification communicates quality or approval under the platform’s rules. It does not grant appropriate permissions, prevent data leakage or make a report compliant with every organizational requirement.
How Do You Roll Out Governed Self-Service Reporting Without Slowing Everyone Down?
Governing every dataset and dashboard at once is usually harder than starting with a defined set of valuable metrics and expanding. Microsoft describes three timing approaches: rolling out first and governing later, planning governance fully before rollout, or planning iteratively and rolling out in stages. It calls the iterative approach the best fit for most organizations, and recommends the most lightweight governance model that meets your objectives. A practical implementation follows three phases.
Phase 1: Establish a Trusted Foundation
Scope: One business function, a small group of active analysts and a limited set of important metrics.
Actions:
- Identify reporting inconsistencies that affect current business decisions.
- Select two or three frequently used candidate KPIs.
- Assign business and technical owners.
- Approve calculation definitions and implement the necessary access policies.
- Certify only metrics that meet the agreed acceptance criteria.
Release condition: Pilot users produce matching results from the same approved metric and correctly understand its definition and limitations.
Phase 2: Enable Departmental Self-Service
Scope: Authorized analysts in additional teams that use the certified foundation.
Actions:
- Provide a visible catalog or documented location for approved datasets.
- Explain which models users can explore and which assets are authoritative.
- Offer brief training based on real reporting tasks.
- Let analysts build departmental reports without central approval for every visual change.
- Provide a simple request process for missing metrics, access changes and suspected data errors.
Release condition: Analysts complete representative reporting tasks with approved data while the central team handles exceptions and changes to shared definitions.
Phase 3: Expand Governance Based on Observed Demand
Scope: More departments, reporting assets and reusable analytical models.
Actions:
- Review frequently duplicated calculations and candidates for shared metrics.
- Identify heavily used but unsupported departmental reports.
- Certify additional assets where the business value justifies maintenance.
- Improve inventory, lineage or automated checks where manual processes cause measurable problems.
- Review access permissions and retire obsolete or misleading reports.
Release condition: Ownership stays clear, the approved model catalog stays usable, and growth in report creation doesn’t produce unmanaged growth in conflicting official KPIs.
A small organization may not need a data catalog platform, approval portal or dedicated Center of Excellence. A shared metric register, an existing issue tracker, source-controlled models and a few responsible people can be an adequate starting model.
How Do You Measure Whether BI Governance Is Working?
Judge governance by whether it makes trusted analysis easier and reduces consequential mistakes, not by how many policies or certification badges exist. Microsoft’s guidance also stresses creating measurable success metrics to evaluate governance progress. Use a small scorecard based on problems you can observe.
| Indicator | How to measure it | What it tells you |
|---|---|---|
| Metric consistency | Count unresolved differences between reports claiming to show the same official KPI. | Whether shared definitions reduce conflicting answers. |
| Trusted-source adoption | Measure use of approved models in workflows where they apply. | Whether analysts find governed sources practical. |
| Time to complete reporting tasks | Time users need to complete representative self-service questions. | Whether governance enables or obstructs exploration. |
| Certification turnaround | Elapsed time from a complete request to approval or documented rejection. | Whether review has become a bottleneck. |
| Access-policy failures | Failed authorization tests, confirmed permission defects and exposure incidents. | Whether access safeguards are holding. |
| Ownership completeness | Whether important shared metrics have named owners, definitions and support paths. | Whether certified content remains maintainable. |
Collect a baseline before setting targets. An organization with no metric inventory shouldn’t invent a reduction percentage before understanding the scale of its inconsistencies. Interpret the numbers carefully, too: more reported data-quality problems early in a rollout may reflect better detection rather than worse data, and a low certification count isn’t a failure if experimental work is deliberately kept outside certification.
Review the scorecard with business users and technical owners. If analysts keep avoiding an approved dataset, check whether access is too restrictive, the data is incomplete or the model doesn’t support their questions.
Does Governed Self-Service BI Require a Specific Platform?
No. No single BI product or semantic-layer technology makes an organization’s analytics governed. Governance depends on how definitions, permissions, ownership, certification and processes are configured and maintained. When comparing platforms, ask:
- Can important metrics be centrally defined and reused?
- Can report creators build on shared models without modifying official calculations?
- Are access restrictions enforced across supported query and export paths?
- Can you distinguish experimental, promoted and certified assets?
- Can lineage, dependencies and important changes be investigated?
- Does the permission model support the roles you actually use?
- What additional licensing, engineering and administration work is required?
A large organization with many departments may benefit from advanced semantic modeling, centralized discovery and formal certification. A smaller one may reach adequate consistency with managed SQL models, a documented metric register and clear responsibilities. The right choice depends on data architecture, reporting complexity, team skills, access requirements and budget. For a broader look at deployment and ownership trade-offs, see DataColab’s comparison of cloud BI platforms for scale, governance and cost.
Common Implementation Questions
Should Business Users Be Allowed to Create New Metrics?
Yes, when their data access permits it and the metric is clearly labeled as exploratory or departmental. Requiring approval for every new calculation would undermine useful self-service. However, a new calculation using different business rules must not be presented as an existing certified KPI. When a departmental metric becomes important for wider decisions, submit it for review, shared implementation and possible certification.
Can a Certified KPI Still Produce Different Results Across Reports?
Yes, if reports use different filters, time periods, refresh states, calculation versions or access scopes. Certification reduces ambiguity but doesn’t make every report context identical. To investigate a mismatch, compare the metric version, source model, refresh timestamp, time zone, filters, user permissions and underlying records.
Who Is Responsible When an Official KPI Is Wrong?
The business metric owner is accountable for the approved definition. The technical owner investigates whether the implementation follows that definition. Source-system and security owners handle problems within their boundaries. The governance lead coordinates the certification decision and any withdrawal or revision of certified status. Clear accountability makes correction faster than treating every discrepancy as the BI team’s problem.
Build a Reporting Environment Where Freedom and Trust Reinforce Each Other
The most useful way to frame self-service BI vs governed analytics is not centralized control versus unlimited independence. It is separating the decisions that must stay consistent from the exploratory work that benefits from flexibility.
Business users should be able to ask new questions, design reports and explore permitted data. Official KPIs need approved definitions, ownership, tested implementations and appropriate access restrictions. Certification should make trustworthy information easier to find without becoming an approval step for every exploratory chart.
Start with one critical metric. Document its business rules, assign accountable owners and test the calculation against known records. Make it available through an authorized reporting model, then let a small group of analysts build with it. Expand only when real usage and reporting risks justify more controls.
If you’re designing a governed reporting environment, DataColab can help scope a practical architecture around your data integrations, shared business metrics, reporting workflows and access requirements. A defined first use case and an ownership matrix are good starting points for that conversation.
Pingback:Embedded Analytics for SaaS: What to Build vs Buy