
Cloud BI vs Traditional BI: Governance, Scaling and Hidden Costs
What matters most when comparing cloud BI and traditional BI
- The subscription price is usually the smallest part of the decision. Governance labour, data movement and integration work often decide which option costs less.
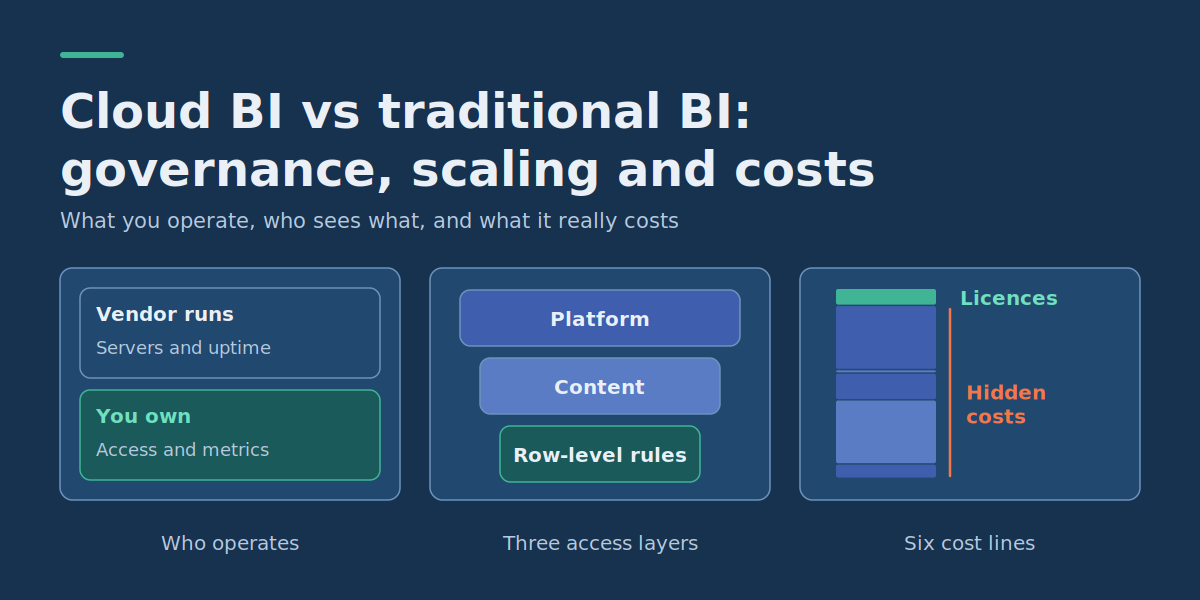
- Cloud BI moves infrastructure operations to the vendor. It does not move accountability for access, metric definitions or data quality.
- Divide total annual cost by the people who actually use the platform, not by licences purchased. That gives a number you can compare across architectures.
- Row-level security, workspace roles and egress paths each need a named owner and a test before launch.
Analytics and IT leaders comparing cloud BI vs traditional BI are rarely choosing between two products. They are choosing who operates the platform, where the data travels and who is responsible when someone sees a number they should not. A cloud BI platform generally lowers the infrastructure burden and speeds up rollout. The trade-off is that costs become usage-shaped: per-user licences, capacity, and charges for data that crosses a provider boundary. A self-hosted platform gives you more control over where data sits and a flatter cost curve at high scale, but you inherit patching, availability and upgrades. This article gives you a vendor-neutral worksheet and two checklists so you can test either route against your own numbers.
Cloud, self-hosted and hybrid BI: what you actually operate
In this article, cloud BI means a BI service run by a vendor or cloud provider that users reach through a browser, with the vendor responsible for servers, patching and availability. Traditional (self-hosted) BI means BI server software that your team installs and runs on infrastructure you control, on-premises or in your own cloud account. Hybrid usually means a cloud BI front end reading data that stays in your network through a gateway or private connection.
The useful comparison is the split of responsibility, not the marketing label.
| Responsibility | Cloud BI (SaaS) | Self-hosted BI | Hybrid |
|---|---|---|---|
| Servers, patching, uptime | Vendor | You | Vendor for the front end, you for gateways and sources |
| Who can log in and see what | You (inside the vendor’s controls) | You | You, across two systems |
| Metric definitions (semantic layer) | You | You | You |
| Data location and movement | Shared: your choice of region and connection | You | You, with a boundary to manage |
| Cost shape | Recurring, grows with users, capacity and transfer | Licence plus infrastructure plus staff time | Both, plus connector upkeep |
Choose cloud BI when your data already lives in a cloud warehouse, your IT team is small, and you want to avoid running a reporting server. If speed to the first dashboard is your main driver, start with our guide to the best BI tools for fast reporting. Choose self-hosted when regulation or contract terms keep data inside your network, or when you already have spare infrastructure and admin capacity. Neither is right if nobody owns governance: both will produce conflicting dashboards, just at different speeds.
Access: three permission layers, not one
Most “security configuration” problems in BI come from treating access as a single switch. In practice there are three layers, and a gap in any one of them defeats the others.
- Platform and workspace access: who can sign in, which workspaces or folders they enter, and whether they can edit or only view.
- Content access: which reports, dashboards and shared apps a person can open.
- Data access: which rows and columns they can see inside the model, and what the source system allows underneath.
Row-level security (RLS) is the data-layer control, and it has sharp edges worth testing for. On many platforms, users with edit or admin rights on a model can bypass row-level rules, and the built-in “test as role” feature may not cover every connection type, such as live queries with single sign-on. Implementations differ, so ask each vendor where row-level rules are enforced, which roles bypass them, and how you will test them.
The model is also where the rules should live. Defining roles and rules once in a shared semantic model means every report built on it inherits the same restrictions. That is a good reason to put security in a shared model instead of recreating filters report by report.
The semantic layer: where governance becomes real
A semantic layer is the shared definition of what “revenue”, “active customer” or “on-time delivery” means, stored once and reused by every report. It is the point where cloud BI governance either holds or fragments.
You have three realistic places to put it. Inside the BI tool’s own model is fastest to start and ties your definitions to that vendor’s format. In the warehouse, as views or a metrics layer, keeps definitions portable across tools but adds engineering work. Split across both works when a central team owns core metrics and departments extend them, but it needs clear rules about who may override what. Decide this before you compare vendors, because a platform that is cheap per user can become expensive if every team rebuilds the same definitions separately. For a closer look at balancing business-led reporting with central control, see our self-service BI and governed analytics comparison.
Governance also has a human side that no platform removes. Microsoft’s governance guidance in its Fabric adoption roadmap explains that governance decisions are put into practice through documented guidance, policies and processes, and that the real focus is on governing what users do with data. It recommends the most lightweight governance model that still meets your objectives, and notes that introducing new guidelines and policies too often causes user disruption. Its Center of Excellence guidance describes a COE as an internal team of technical and business experts who help others work with data. It adds that formal recognition on the org chart is recommended but not required, and that it is common to scope a COE more broadly than one tool, for example as a data or analytics COE. The practical reading: budget for people who set and maintain rules, and change the rules deliberately rather than constantly.
Governance decision points
| Decision | Typical options | Who should own it | What breaks if skipped |
|---|---|---|---|
| Who may publish to shared spaces | Central team only; certified creators; anyone | BI lead with business sponsor | Duplicate, conflicting dashboards |
| Where core metrics are defined | BI tool model; warehouse layer; both | Data or analytics lead | Same metric, different answers |
| How row-level rules are maintained | Static roles; dynamic rules from a mapping table | Data owner plus security | Stale access after reorganisations |
| Which features are enabled for whom | Admin settings by group | Platform administrator | Uncontrolled sharing and exports |
| How exports and extracts are controlled | Disabled; role-limited; logged | Security and data owner | Data leaves the governed environment |
For the fourth row, find the admin settings area of whichever platform you choose, check which features it lets you switch on or off for which groups, and confirm who holds the keys.
Cost categories that subscription pages leave out
A price list covers licences. A total cost view covers six categories, and the last four are the usual source of surprises.
- Licences or subscription: per-user tiers, capacity-based pricing, or a mix. Ask what happens to the price when viewers, not creators, grow tenfold.
- Capacity or infrastructure: reserved compute in the cloud, or servers, storage, backup and disaster recovery on your side.
- Data movement: charges when data crosses a billing boundary. Major cloud providers generally charge for outbound transfer, and the rate typically depends on whether traffic leaves the provider, crosses regions or stays within one. Check your provider’s current price list for your regions.
- Integration and pipelines: connectors, gateways, transformation jobs, and the people who keep them running.
- Governance and administration: the part-time or full-time effort to manage roles, certify content, review access and answer “why do these two numbers differ?”
- Training, migration and exit: onboarding new users, rebuilding reports if you switch, and what it costs to leave.
Licensing packaging also changes over time across vendors. That is not a criticism of any one of them; it is a reason to ask for renewal terms and price-change notice in writing.
A vendor-neutral TCO worksheet with a worked example
The worksheet below compares three architectures on the same six categories and divides each total by the number of stakeholders. Every number in this example is an illustrative assumption, not a vendor price or a benchmark. Replace them with quotes and internal estimates before drawing any conclusion.
Illustrative assumptions
- 400 stakeholders who use BI: 40 creators, 60 explorers (filter and drill) and 300 viewers.
- Option A: per-user cloud licences at assumed annual rates of 240 per creator, 120 per explorer and 60 per viewer.
- Option B: capacity-based cloud pricing at an assumed 36,000 a year, plus creator licences (40 × 240 = 9,600). Viewers need no individual licence.
- Option C: self-hosted, with an assumed 25,000 software licence and 18,000 for infrastructure on existing virtualisation.
- Governance and admin labour is estimated at 0.3, 0.4 and 0.5 of a full-time person for A, B and C, at an assumed loaded cost of 90,000 per person-year. Capacity tuning and server operations explain the higher figures.
- Data movement for A and B uses the egress estimate in the next table at an assumed 0.08 per GB. Option C keeps data inside the network, so this is 0.
- Currency is deliberately unspecified; treat the figures as generic units.
Worked TCO table (annual, illustrative)
| Cost category | A: per-user cloud | B: capacity cloud | C: self-hosted |
|---|---|---|---|
| Licences | 34,800 | 9,600 | 25,000 |
| Capacity / infrastructure | 0 | 36,000 | 18,000 |
| Data movement | 1,920 | 1,920 | 0 |
| Integration and pipelines | 15,000 | 15,000 | 12,000 |
| Governance and admin labour | 27,000 | 36,000 | 45,000 |
| Training and support | 8,000 | 8,000 | 8,000 |
| Total | 86,720 | 106,520 | 108,000 |
| Cost per stakeholder (÷ 400) | 216.80 | 266.30 | 270.00 |
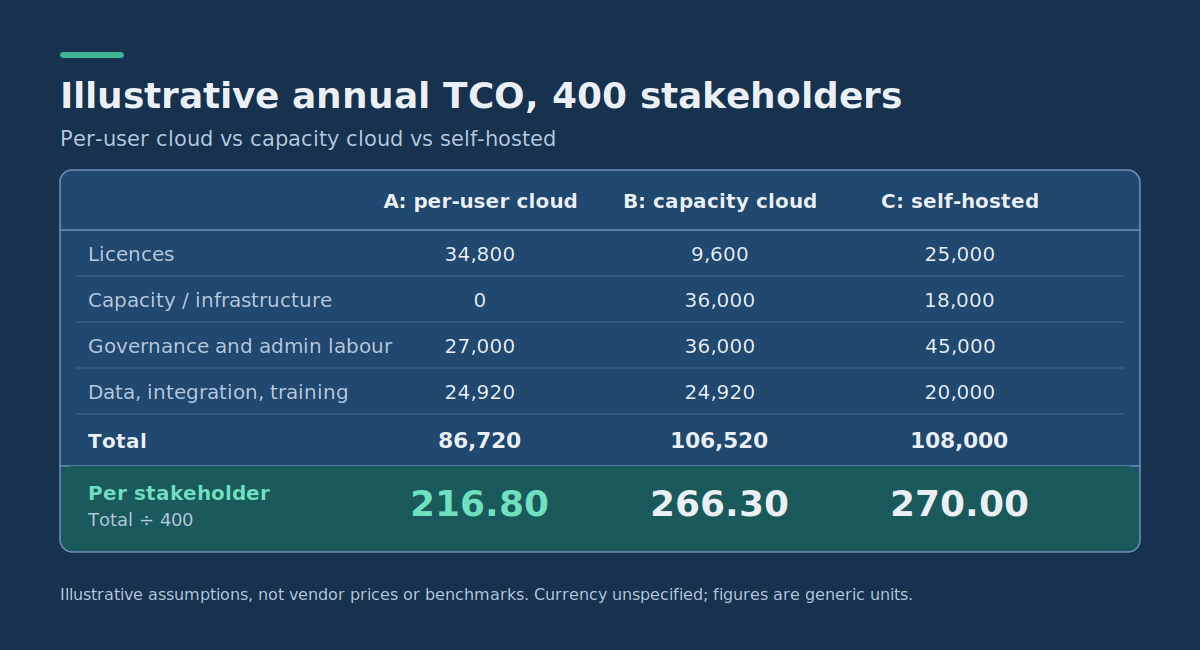
Check the licence line for Option A: 40 × 240 = 9,600; 60 × 120 = 7,200; 300 × 60 = 18,000; the three add up to 34,800. At this size, per-user licensing comes out lowest, and the gap between B and C is small enough that a modest change in admin time would reverse them. That is the point of the exercise: the ranking depends on assumptions you can inspect, not on the vendor’s headline price.
What changes when the user base triples
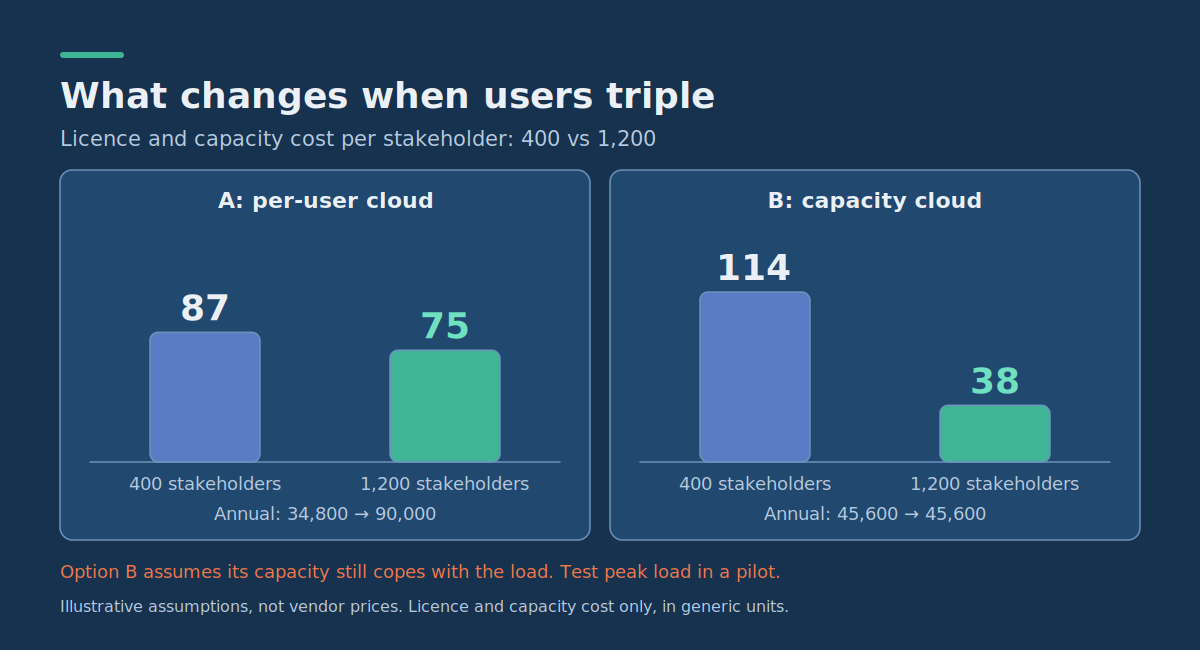
Now assume 1,200 stakeholders: the same 40 creators, 180 explorers and 980 viewers, and assume the capacity in Option B still copes with the load (a major assumption you must test).
| Licence and capacity cost only | 400 stakeholders | 1,200 stakeholders |
|---|---|---|
| A: per-user (annual) | 34,800 | 90,000 |
| A: per stakeholder | 87 | 75 |
| B: capacity plus creators (annual) | 45,600 | 45,600 |
| B: per stakeholder | 114 | 38 |
The Option A figure at 1,200 is 9,600 + (180 × 120 = 21,600) + (980 × 60 = 58,800) = 90,000. Capacity pricing wins as viewers grow, but only while refresh and query load fit the purchased capacity. If heavy refreshes or large models force a bigger tier, the flat line steps upward. Measure peak load in a pilot before you trust the flat curve.
Data-egress estimate (illustrative)
Estimate monthly transfer as gigabytes per refresh × refreshes per day × 30, plus anything users export. Only count traffic that crosses a billed boundary, which depends on where your BI service, warehouse and sources sit.
| Item | GB per refresh | Refreshes per day | GB per month |
|---|---|---|---|
| Sales model | 5 | 8 | 1,200 |
| Finance model | 2 | 2 | 120 |
| Operations model | 10 | 1 | 300 |
| Scheduled exports and extracts | n/a | n/a | 380 |
| Total | 2,000 |
At the assumed 0.08 per GB, 2,000 GB is 160 a month, or 1,920 a year, the figure used in the TCO table. That is small here. It becomes material when a large model refreshes hourly across regions, or when the BI service and the warehouse sit with different providers. Move the refresh schedule to what the business actually needs and the line shrinks.
How to use and adapt the worksheet
- Count real stakeholders by tier from login or usage data. If you have no history, survey department heads and add a margin.
- Replace each assumption with a written quote or an internal estimate, and mark which ones are still guesses.
- Add a line for anything specific to you, such as embedded analytics, a regulated audit process or a migration project.
- Divide by active stakeholders, meaning people who opened a report in the last 90 days, not by licences bought. Unused licences then show up as a cost problem instead of hiding in the average.
- Re-run the numbers at 1.5× and 3× users, and with refresh frequency doubled. If the ranking flips, that is the risk to negotiate or test.
Sample deployment patterns and where data moves
These three diagrams show the same sources reaching users. The marked arrows are the places to ask about egress, latency and access control.
Pattern 1: fully cloud
[SaaS apps / databases] --(1)--> [Cloud warehouse, region X]
        --(2)--> [BI service, region ?] --(3)--> [Users via browser]
(1) ingestion: usually free to receive, check connector costs
(2) warehouse to BI service: free or charged depending on region and provider
(3) exports and downloads: leave the governed platform
Pattern 2: hybrid
[On-premises databases] --(1)--> [Gateway / private link]
--(2)--> [Cloud BI service] --(3)--> [Users via browser]
(1) gateway is software you operate and patch
(2) refresh traffic crosses your network boundary
(3) row-level rules must match source-system permissionsPattern 3: self-hosted
[Databases] --(1)--> [BI server in your network]
--(2)--> [Users on office network or VPN]
(1) no provider transfer charge if inside one network
(2) remote access depends on your VPN and availability designPermission and data-egress checklist
Run this before signing a contract and again before go-live. Each item should have a named owner and a recorded test result.
Permissions
- Can you list every role that can edit a data model, and confirm which roles bypass row-level rules?
- Do you manage access through groups from your identity provider rather than individual names?
- Is there a test account for each security role, and has someone checked that restricted rows really disappear, including in exports and in spreadsheet connections?
- Does the platform’s testing tool work with your connection type, or does it have gaps such as single sign-on with live queries?
- Who reviews access when someone changes team, and how often?
- Can administrators see audit logs of who viewed or exported what?
Data movement
- Which region hosts the BI service, the warehouse and each source, and is any traffic crossing a regional or provider boundary?
- How often does each model refresh, and does the business actually need that frequency?
- Are queries sent live to the source at view time, and if so, who pays when many users open a report at 9 a.m.?
- Which export routes exist (downloads, scheduled email, APIs, embedded views), and can they be restricted by role?
- What does it cost, in money and in time, to move your reports and models to another platform later?
Questions to ask every vendor
- Which pricing metric grows fastest for a company like ours: creators, viewers, capacity or data volume?
- What happens when we exceed capacity: throttling, automatic upgrade or a billing surprise?
- Which roles can bypass row-level security, and where is that documented?
- Where are metric definitions stored, and can we export them in a documented format?
- What transfer charges apply between your service and the warehouse or database we already use?
- How much notice do you give before changing license packaging or retiring a plan?
- Can we see published method and customer-verifiable evidence for any performance claim, rather than a headline benchmark?
- What is the exit path: export formats, retention period and fees to retrieve our content?
Be sceptical of any “best platform for scale and governance” claim that does not come with a published method. The honest answer depends on your user mix, data location and who runs governance.
Cloud BI vs traditional BI: quick answers
Is cloud BI cheaper than traditional BI?
Not automatically. In the illustrative worksheet above, per-user cloud licensing was lowest at 400 stakeholders, but the ranking depends on user mix, capacity needs, data movement and governance labor. Run the worksheet with your own numbers.
Does cloud BI remove the need for governance?
No. The vendor runs the infrastructure, but you remain responsible for access, metric definitions and data quality.
What should I test before launching a BI platform?
Test row-level security for every role, including exports and spreadsheet connections, and confirm which roles bypass those rules. Then check where data crosses a billed boundary and who owns each control.
Next step
Fill in the worksheet with your own user counts and two real quotes, then ask which line item would change the ranking if it moved by 30 percent. That is the number to negotiate or pilot first. If you would like help with your own numbers, DataColab, a provider of custom software development for business workflows, data and applied-AI solutions for international clients, can discuss a BI architecture and implementation assessment for your situation.