If you are searching for a clear data science workflow example to follow, this guide will walk you through every step. In today’s data-driven world, successful projects do not happen by accident. They unfold in stages, guided by methods that help you turn questions into actionable insights. Whether you are a beginner or leading a team, understanding each step of a standard workflow can save time, avoid mistakes, and improve results. Within this article, you will see a real-world process, essential tools, and practical ways to apply each phase—even if you are just starting out. Let’s dive in.
What Is a Data Science Workflow Example?
A data science workflow example is a sequence of steps that data scientists follow to answer questions and deliver useful results from data. Think of it as a roadmap: it covers understanding your objective, gathering relevant data, cleaning messy information, building models, checking outcomes, and sharing findings.
Instead of jumping right into coding or experiments, proven workflows encourage you to start by asking the right questions, then move forward methodically. Following a solid workflow helps avoid common pitfalls like missed steps or poor documentation.

Why Is a Data Science Workflow Example Important?
A well-defined data science workflow example improves project efficiency by making sure you have a plan. Data projects often involve multiple people—analysts, engineers, stakeholders—and without a clear process, things can quickly become confusing. Teams might waste time duplicating work, miss important cleaning phases, or build unreliable models.
Workflows streamline collaboration and provide structure. For those interested in project management, understanding the data science workflow can serve as a foundation for organizing your work and keeping your team on track.
What Are the Key Stages in a Typical Data Science Workflow Example?
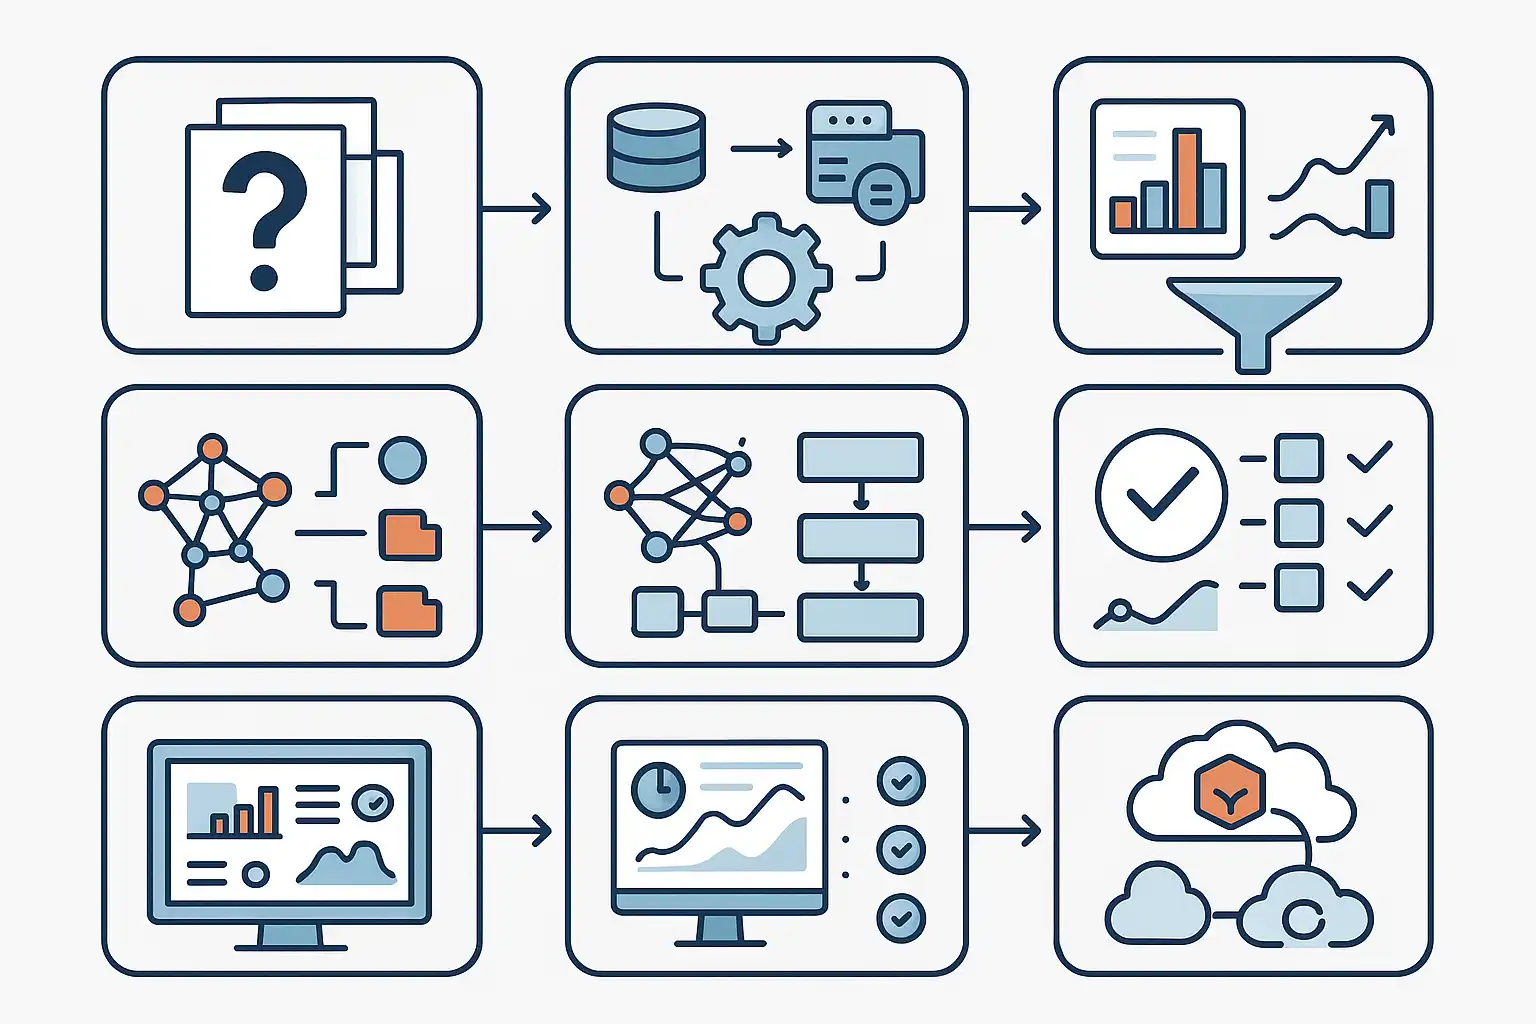
Data science experts across the world tend to agree on a handful of essential stages in the workflow. Let’s break them down using examples from respected frameworks such as CRISP-DM, Harvard’s model, and OSEMN:
- Define or Understand the Problem: Before touching any data, clarify the business or research question. What do you want to solve or improve? This phase might involve meetings with stakeholders, recognizing pain points, or setting specific goals.
- Acquire the Data: Collect the data you need. This can include downloading datasets, connecting to APIs, extracting records from databases, or even scraping web data. The goal is to ensure you have all the information that could answer your question.
- Explore and Clean the Data: Real-world data is often messy. Explore it using summary statistics and visualizations. Handle missing values, outliers, or inconsistencies. This phase is sometimes called “Scrubbing” or “Data Preparation.”
- Model the Data: This is the core analysis phase. Select and train statistical or machine learning models that suit your problem. You might use techniques like regression, classification, clustering, or time series forecasting.
- Evaluate the Model: Check your model’s performance. Does it meet your goals? Use validation techniques, accuracy metrics, or confusion matrices to measure success and identify issues.
- Communicate and Visualize Results: Translate technical findings into clear insights. Build charts, dashboards, or presentations for your audience. This step ensures stakeholders understand what the data says and what actions to take.
- Deploy and Monitor: For many business projects, finished models must be put into production environments. This involves deploying models via web apps, dashboards, or APIs, and monitoring their ongoing performance to catch changes over time.
Each stage forms a critical part of the overall data science workflow example, and effective workflows usually allow for iteration. Teams often loop back to previous steps—especially if results or assumptions change.
How Does It Look In Practice? A Sample Data Science Workflow Example
Let’s see how a real-world data science workflow example unfolds step by step, using a fictional company that wants to predict customer churn (the rate at which customers leave their service).
Step 1: Clarify the Problem
The team meets with business leaders to define the problem: “Can we predict which customers are likely to leave next quarter?” The group identifies what a ‘churned’ customer is, what period to analyze, and how results will be used.
Step 2: Gather the Data
Data is gathered from the company’s CRM database, along with external sources such as customer feedback surveys. The team extracts fields such as age, contract length, payment method, and usage stats relevant to customer behavior.
Step 3: Explore and Clean the Data
Once the data is imported, the team uses Python tools like pandas and matplotlib to explore basic statistics. They handle missing values (e.g., filled with averages or removed), correct errors, and ensure formats (such as date fields) are consistent across records.
Step 4: Model the Data
The team chooses a predictive modeling approach. They split their dataset into training and testing samples, select a decision tree classifier, and use scikit-learn to build the model.
Step 5: Evaluate the Model
Using confusion matrices and ROC curves, they test how well the model predicts churn. If the accuracy is too low, they may tune model parameters or engineer new features from the data.
Step 6: Communicate Results
The results are presented as a dashboard using Tableau. Clear charts highlight which factors most influence churn, and recommendations are provided for the marketing team.
Step 7: Deploy and Monitor the Solution
The finished model is integrated into the company’s customer management software, flagging high-risk customers in real time. The model is monitored for accuracy as new data comes in, and the process repeats if ongoing changes require updates.
Throughout each step, the team documents decisions, ensuring the results can be reproduced and explained to others. This structure keeps the project on track, reduces risks, and makes sure nothing important is skipped.

How Does a Data Science Workflow Example Improve Project Efficiency?
A well-structured data science workflow example streamlines projects in several ways. First, it helps everyone understand what comes next. With a clear roadmap, tasks can be assigned, tracked, and completed methodically. This reduces confusion and repeated work.
For instance, if you use a workflow based on CRISP-DM or OSEMN, your team knows to finish data cleaning before jumping into advanced modeling. This approach helps avoid errors that could creep in if messy data is used for analysis.
Additionally, workflows support documentation and knowledge sharing. If a team member leaves or a new analyst joins, they can follow the documented steps and get up to speed much quicker. This consistency is especially valuable in large organizations or in regulated industries.
By structuring your process, a workflow also encourages iteration. If, during model evaluation, you discover low accuracy, you can return to previous steps (like feature engineering or data cleaning) and try new approaches—rather than starting over from scratch.
Many companies, when implementing new data initiatives, look for resources like a Data Science Project Management Template to keep projects organized and workflows transparent for all participants.
Which Tools and Techniques Are Used in Each Phase?
Let’s break down the most common tools and methods used at every stage of a typical data science workflow example:
| Stage | Tools & Techniques |
|---|---|
| Understand the Problem | Stakeholder interviews, business analysis tools, requirements documentation |
| Gather Data | SQL databases, APIs, Python (pandas, requests), ETL tools (Apache Airflow) |
| Clean/Explore | Pandas, R, Jupyter Notebooks, visualization (matplotlib, seaborn), data profiling |
| Modeling | Scikit-learn, R caret, TensorFlow, decision trees, logistic regression, clustering algorithms |
| Evaluation | Cross-validation, confusion matrices, ROC curves, precision/recall metrics |
| Communication | Tableau, Power BI, matplotlib, dashboards, slide decks |
| Deployment | AWS/Azure/Google Cloud, Docker, REST APIs, Model monitoring frameworks |
The specific toolset depends on your stack (Python vs R), your organization’s infrastructure, and the expertise of the team. Modern cloud platforms like IBM Watson Studio also enable teams to manage many of these parts within a single environment, from data prep to deployment.
How Do Different Data Science Workflow Frameworks Compare?
Over time, several major workflow frameworks have been created to help guide data science projects. Here is a brief comparison of the most popular ones:
- CRISP-DM (Cross-Industry Standard Process for Data Mining): Widely adopted. Six phases: Business Understanding, Data Understanding, Data Preparation, Modeling, Evaluation, Deployment. Emphasizes iteration—teams often loop back to earlier phases based on results.
- Harvard’s Data Science Workflow: Divides the project into five steps: Ask an interesting question, Get the data, Explore the data, Model the data, Communicate/visualize results. Simple and easy to remember; ideal for education or smaller projects.
- OSEMN: Stands for Obtain, Scrub, Explore, Model, and iNterpret. Focuses on the “messy” data reality, highlighting the time and effort involved in cleaning before modeling.
- Enterprise Workflows: Aakanksha Joshi and Aakash Tandel suggest detailed frameworks that incorporate not only technical tasks but also cloud platforms (such as IBM Watson Studio), team roles, and business communication.
Choosing the right workflow depends on your project’s goals, team structure, and preferred level of detail. Some companies combine elements from several frameworks to fit their specific needs. For larger data teams, reading resources like The Data Science Project Management Book can help clarify how to build a custom workflow that matches your environment.
How Do You Make Your Data Science Workflow Iterative?
Iteration is a hallmark of a successful data science workflow example. Rarely do you move through all the stages in a single go. Instead, many phases require revisiting as you learn more.
For example, model evaluation might reveal that certain data features are not helpful, prompting a return to the data preparation phase. Similarly, if business needs shift mid-project, you may need to revisit your original problem statement and adjust your approach.
Embracing an iterative mindset means:
- Being open to feedback and new insights at each stage.
- Documenting changes and decision points to preserve the logic behind your process.
- Testing different tools and methods—then selecting what works best for your unique situation.
- Celebrating “failures” as opportunities to improve, not as wasted effort.
Iterative workflows support continuous learning, making your results more reliable and actionable over time.
What Challenges Do Data Science Teams Face Without a Workflow?
Teams that skip clear workflows often get stuck in common traps:
- Lack of Clarity: Without a process, individuals may work on different priorities, causing confusion.
- Missed Steps: Skipping data cleaning or improper validation leads to unreliable models.
- Poor Communication: If findings aren’t shared in understandable ways, valuable insights may go unused.
- Inefficient Use of Time: Redundant work and re-analysis waste resources.
- Hard-to-Reproduce Results: Without documentation, it’s hard for others to replicate your analysis later.
To avoid these issues, teams often seek inspiration from other fields. For example, in data engineering, people rely on well-documented data processing workflows to ensure end-to-end quality. Borrowing these habits makes data science projects smoother and more successful.
How Can You Adapt a Workflow Example to Fit Your Team?
Every organization has its own needs, tools, and constraints. The best data science workflow example is one you can adapt. Start simple—use a recognized framework (CRISP-DM, OSEMN, Harvard) as a template. Tailor it to your reality by adding or removing steps, assigning clear roles, and choosing compatible tools.
Encourage regular check-ins and retrospectives. Ask your team what works, what causes friction, and how the process could be improved. Document workflow changes so everyone stays informed. As your organization grows, revisit your workflow to account for new technologies, regulations, or business goals.
What Are Some Tips for Successfully Following a Data Science Workflow Example?
Here are some actionable tips for applying a data science workflow in your own projects:
- Start With The End in Mind: Know the business objective before diving into the data. This keeps efforts focused and relevant.
- Document Everything: Keep notes at every major decision point, including assumptions and rationale.
- Assign Roles: Data science projects rarely happen alone. Clarify who is responsible for what at each stage.
- Use Version Control: Store code, notebooks, and data scripts in shared repositories. Git and cloud-based platforms make collaboration easy.
- Focus on Communication: Don’t assume everyone understands jargon. Use simple charts, clear language, and actionable summaries when presenting results.
- Iterate Often: Don’t wait for “perfect” results before sharing. Early feedback improves outcomes.
- Review and Reflect: After each project, hold a retrospective. What worked? What didn’t? Adjust your workflow for next time.
FAQ
How does documenting each step in a data science workflow example help teams?
Documenting every stage in a data science workflow example ensures that all tasks are transparent and repeatable. It helps new team members quickly understand past decisions and reasoning. Detailed documentation also supports compliance, facilitates audits, and allows for consistent results, especially as projects become more complex or teams expand.
Can you change your workflow steps as your data project evolves?
Yes, a good workflow is flexible. As you learn more about your data or business needs change, it’s common to revisit and revise previous steps. Iterative workflows allow you to loop back and make improvements without starting over, making your approach adaptive and resilient.
Is it better to use one standardized workflow, or tailor one for each project?
While starting with a proven framework is wise, tailoring your workflow to suit specific project goals, tools, or stakeholder needs is usually best. Customization makes the workflow more relevant and effective, while still preserving structure and discipline throughout the project.
What is the difference between data science workflows and data processing workflows?
Data science workflows focus on turning data into insights, starting with a question and ending with actionable recommendations or deployed models. In contrast, data processing workflows deal more with the technical movement, transformation, and cleaning of data as it moves through systems. Both are essential, and often overlap within larger analytics organizations.