Understanding how raw data transforms into business decisions is crucial in today’s data-driven world. The data analytics process steps guide individuals and organizations through a sequence that turns scattered information into actionable insights. Whether you’re a business owner, student, or simply curious, following this process can help unlock the value hidden in your data.
What are the main steps in the data analytics process?
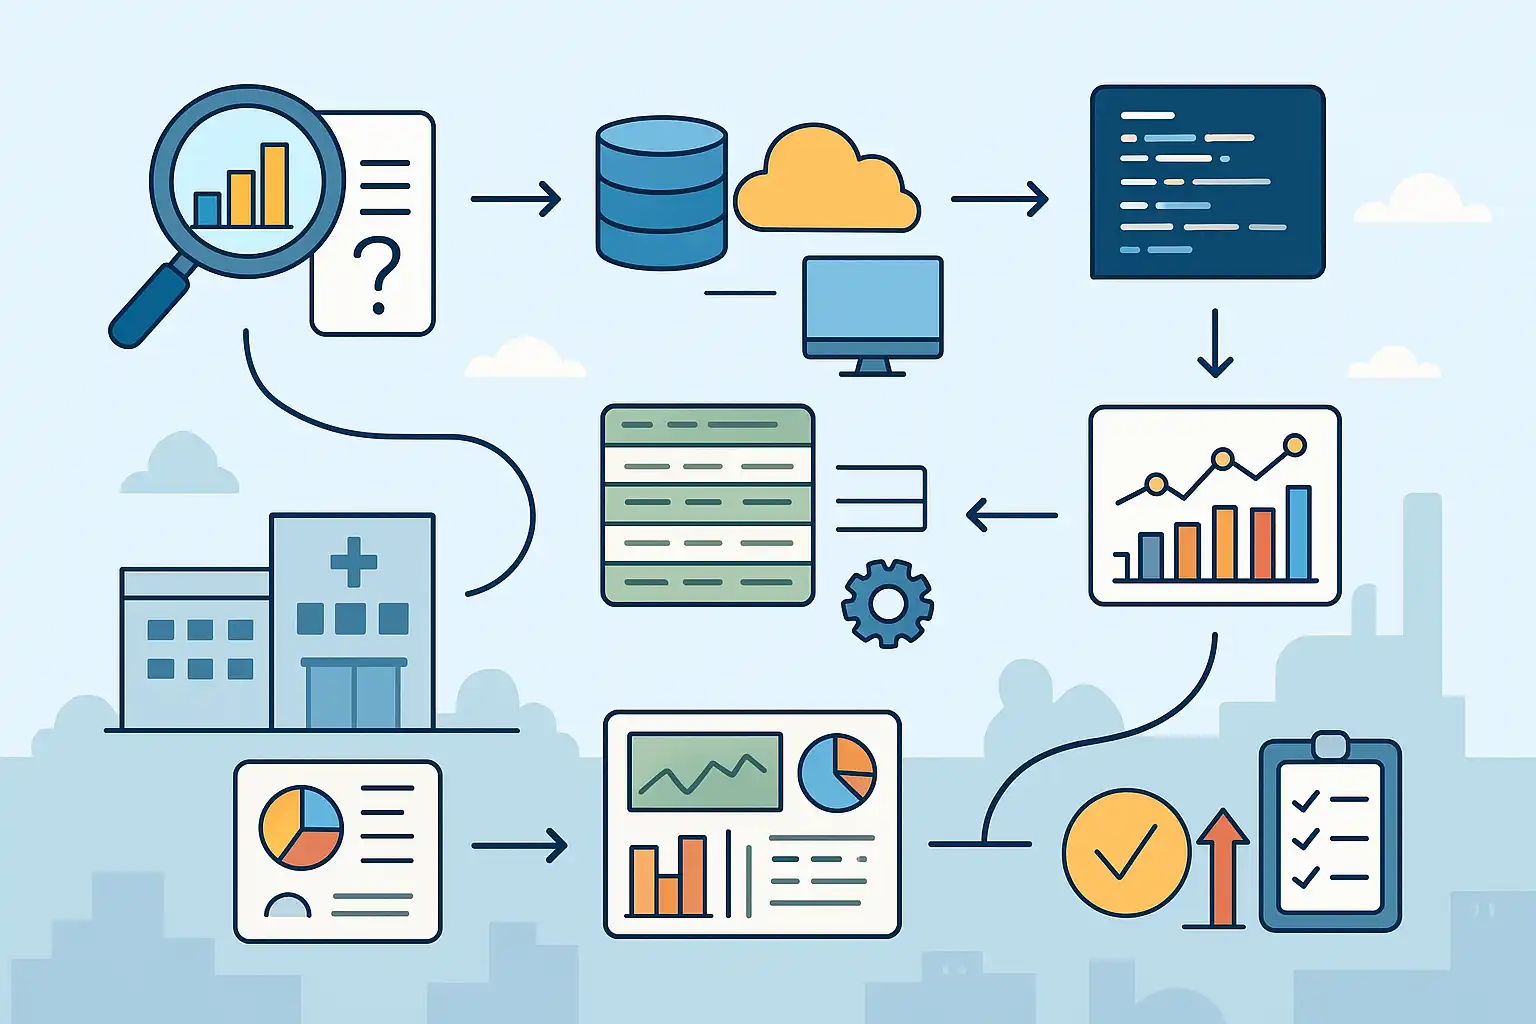
The data analytics process is made up of six key steps that guide one from raw data to informed decisions. Each stage has a clear purpose, ensuring nothing is missed along the way. Whether you are new to analytics or seeking clarity, knowing these stages sets you on the right path.
- Define the Problem: It’s essential to begin with a precise question. This means identifying the core issue, understanding what you want to achieve, and setting clear objectives. Without a well-defined problem, analysis can easily go off track. For example, a retailer might ask, “Why did sales drop in the last quarter?” This guides the entire process.
- Data Collection: Next, gather the relevant data. This may involve extracting information from databases, using public datasets, or conducting surveys. Careful documentation of data sources and types makes later steps smoother. Make sure to collect enough data so your insights are reliable.
- Data Cleaning and Preparation: Raw data is rarely perfect. It often contains errors, missing values, duplicates, or inconsistent formats. Cleaning data means fixing these problems by standardizing formats and removing irrelevant entries. Tools like Excel, Python, or R are commonly used for these tasks.
- Data Analysis: Now, the real number crunching begins. Analysts look for trends, patterns, or relationships using statistical techniques or advanced models such as regression or clustering. This step transforms cleaned data into meaningful insights and answers the original question.
- Visualization: Presenting results with charts, graphs, or dashboards makes complex data understandable. Not everyone can spot trends in a spreadsheet, but a clear graph communicates the message instantly. Visualization tools like Tableau, Power BI, or Google Data Studio are popular options.
- Interpretation and Decision-Making: Finally, turn findings into action. This involves explaining results to stakeholders, recommending next steps, and monitoring how decisions impact outcomes. Communication should be clear, focusing on what the insights mean for the organization.
Why is data cleaning important in analytics?
Data cleaning sits at the heart of reliable analytics. Even the best models or charts are not helpful if the underlying data is messy. Raw data usually includes mistakes—think empty cells, duplicate rows, inconsistent spelling, or outlier values. If these issues aren’t addressed, results can be misleading or completely wrong.
By carefully cleaning and preparing data, analysts improve its accuracy and consistency. This increases confidence in the insights generated. For example, a company trying to forecast customer demand will get inaccurate results if their sales figures include repeated entries or missing values. Using data science workflow best practices helps integrate automated tools and checks, saving time and reducing errors in data cleaning.
How does data cleaning boost analytics accuracy?
Data cleaning ensures each variable is formatted correctly, missing values are handled, and all records make sense together. Removing errors reduces the risk of incorrect conclusions. Analysts may use methods like imputing missing values (filling them in based on patterns), standardizing text, or eliminating duplicates. When data is well-prepared, models perform better and results are easier to trust.

How do you turn insights into business decisions?
Gaining insights is only valuable if they lead to action. The final step in the process is taking those findings and using them to inform business decisions. This requires both clear communication and an understanding of the original problem.
Effective decision-making involves translating complex analytics into simple stories or recommendations. For instance, a marketing team may be shown that customers aged 25-34 engage most with their campaigns. The recommendation could be to focus future efforts on this group. Visualizations and clear language make it easier for decision-makers to understand and act.
Additionally, it’s important to monitor what happens after decisions are implemented. This feedback loop allows organizations to adjust their strategies and repeat the analytics process as needed. In many industries, automated reporting insights play a vital role, providing timely updates so leaders can respond quickly to changes in their data.
Common tools and methods for decision-making
- Dashboards: Real-time displays that show key metrics to managers and staff.
- Reports: Summaries of analysis tailored for different audiences—some prefer detailed tables, while others want high-level takeaways.
- Predictive Models: Tools that forecast future outcomes based on past data, helping organizations plan ahead.
- Workshops or Presentations: Meetings where analysts explain results, field questions, and recommend specific actions.
What challenges can arise during the data analytics process steps?
Despite its structure, the data analytics process steps aren’t always straightforward. Several challenges can pop up at different stages:
- Accessibility: Sometimes key data is locked away in separate systems or hard to access, slowing down collection.
- Quality: Poor data quality leads to unreliable results, so extra effort may be needed in cleaning and validation.
- Siloed Teams: When teams don’t share data, valuable insights are missed.
- Complex Analysis: Some questions require advanced techniques or tools, making analysis tough without specialized skills.
- Interpreting results: Not everyone has a statistics background, so communicating findings in an understandable way is essential. Visualizations help here, as does clear language.
For growing organizations, developing data processing workflows is an effective strategy. Such workflows help standardize and automate repetitive tasks, making the process more efficient and less error-prone.
Overcoming obstacles in analytics
Solutions to these challenges include investing in user-friendly analytics tools, providing training, and fostering collaboration between departments. Documenting each step from data collection to decision-making ensures transparency and repeatability.
Which industries benefit most from the data analytics process steps?
The data analytics process steps apply across nearly every industry. Here are some common examples:
- Retail: Retailers analyze sales data to predict trends, optimize inventory, and personalize marketing campaigns.
- Healthcare: Hospitals and clinics use analytics to improve patient outcomes, manage resources, and spot health trends.
- Finance: Banks detect fraudulent transactions and assess risks using advanced models.
- Manufacturing: Factories monitor production efficiency, predict equipment failures, and reduce downtime.
- Small Businesses: Even with limited resources, small companies can use small‑business analytics to better understand customers, target marketing, and control costs, driving sustainable growth.
In each case, the basic process—define, collect, clean, analyze, visualize, and act—remains the same. What changes is the type of data, the tools used, and the specific business goals.
Real-world success stories
Consider a local retailer who noticed declining sales. By following the analytics process, they discovered that a new competitor had opened nearby, and certain products were consistently out of stock. Using these insights, they adjusted inventory and ran targeted promotions, leading to a 15% sales increase in the next quarter.
In another example, a hospital reduced patient wait times by analyzing check-in and appointment data. By identifying bottlenecks and reallocating staff, overall patient satisfaction improved.

Answers to common data analytics process steps questions
Q: How do you start a data analytics project?
Begin by clearly defining the business problem. Make sure goals and expected outcomes are well understood. Once you have a question in mind, gather relevant data and document your plan. This preparation lays a strong foundation for the remaining steps.
Q: What are the best practices for data cleaning?
Good practices include handling missing data, ensuring formats are consistent, removing duplicates, and validating entries. Tools like Python’s pandas or R’s tidyverse can automate many cleaning tasks, saving time and reducing errors.
Q: How does visualization help with decision-making?
Visualization turns numbers into pictures, making it easier to spot trends or outliers. Decision-makers can quickly grasp complex information and act with confidence, even if they lack technical expertise.
Q: Can small businesses use the same data analytics process steps as large enterprises?
Absolutely. The steps are universal, though the scale and tools may differ. Free or low-cost tools, combined with a disciplined approach, allow small companies to gain insights and compete more effectively.
Whether you’re running a large corporation or launching a startup, following the data analytics process steps ensures that decisions are based on evidence, not guesswork. By applying these principles, anyone can unlock the value of their data and drive better results.