If you’re starting a BI tools pricing comparison, you want to make a fair and complete evaluation—without falling into hidden cost traps. Figuring out which business intelligence platform gives you the most value isn’t just about sticker price. Decision makers need to look deeper to avoid surprise expenses and ensure their investment really supports business goals. In this guide, you’ll learn exactly what to watch for and how to compare BI tool pricing thoroughly, so you’ll never overlook crucial costs.
What are the key steps to a complete BI tools pricing comparison?
Most people begin with the subscription or license fee, but successful BI tools pricing comparison requires a more detailed, step-by-step approach. Here’s how you can set yourself up for a fair comparison:
- Define Your Business Needs: Decide what features, data sources, and integrations your organization must have. Your requirements guide the rest of the process.
- Identify All Cost Elements: Go beyond initial quotes. Include licensing, infrastructure, professional services, training, and long-term support.
- Compare Pricing Models: Different BI vendors offer a range of pricing structures, from one-time licenses to SaaS subscriptions. Understand which model fits your business size and growth plans.
- Look for Hidden Costs: Investigate expenses often left out of vendor proposals—like data integration, migration, scaling, and ongoing maintenance.
- Assess Total Cost of Ownership (TCO): Add up all predictable costs over at least three years, including “soft costs” like staff time and lost productivity during changeovers.
- Shortlist and Seek References: Talk with experienced users or trusted BI providers to get real-world insight about cost surprises.
By breaking your BI tools pricing comparison into these steps, you can make a data-driven, accurate decision, avoiding unpleasant budget surprises down the road. Let’s get into the details of the hidden costs and how to spot them.
What are the common hidden costs in BI tool pricing?
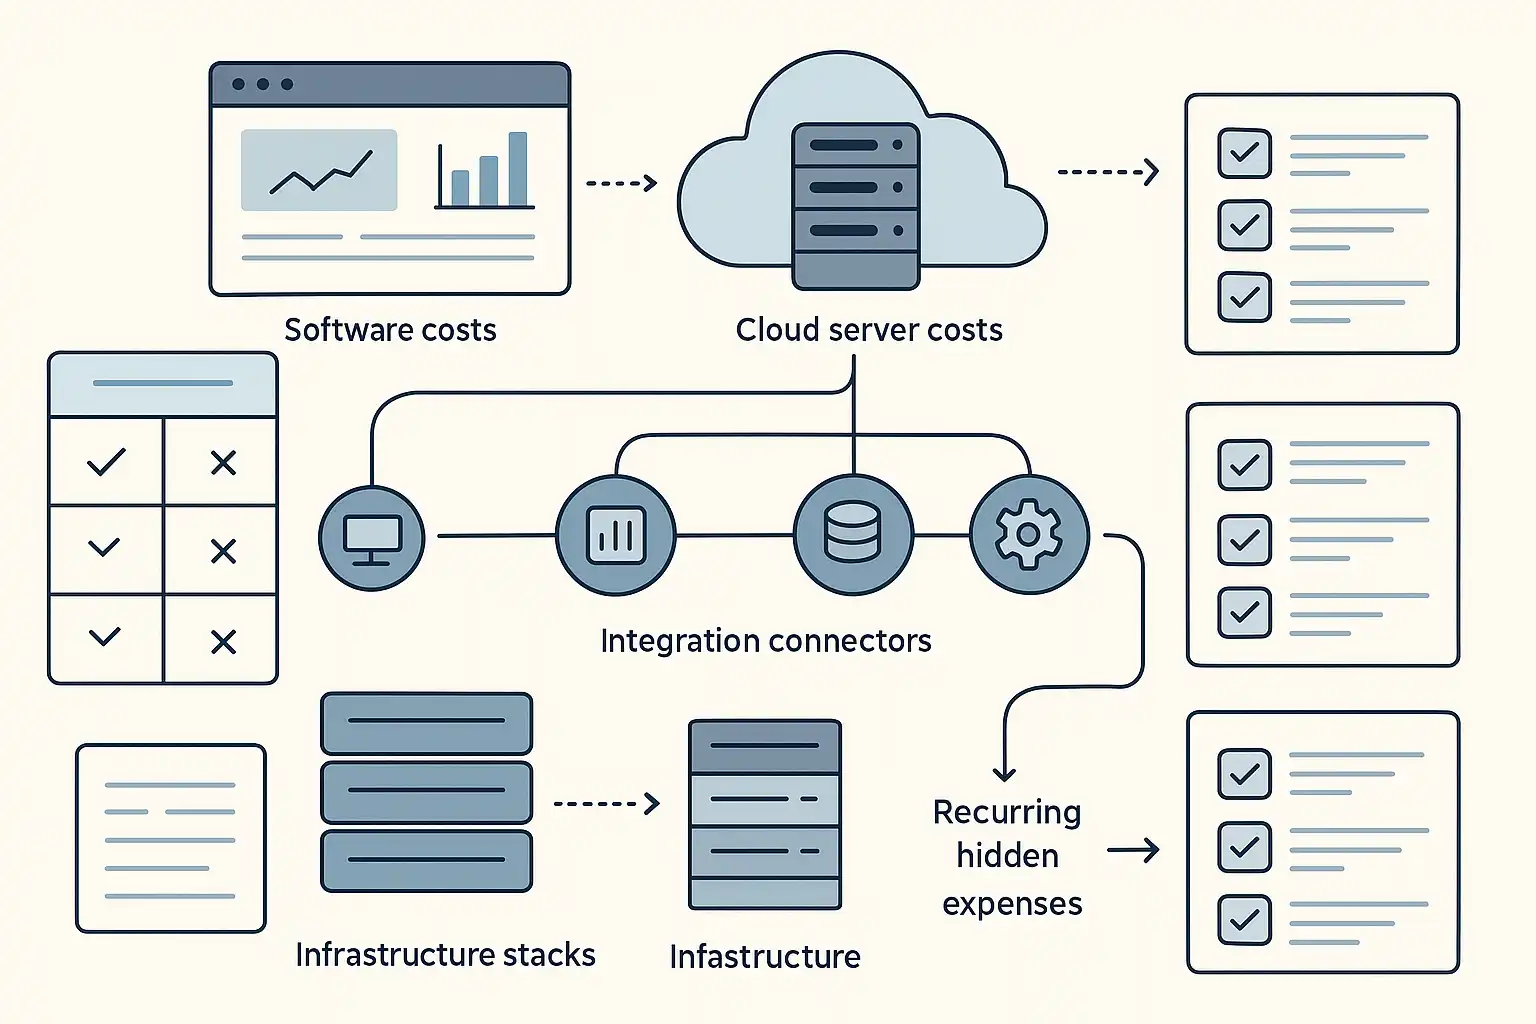
Many organizations focus only on the obvious line items during their BI tools pricing comparison, but hidden costs can dramatically affect your budget and return on investment. Here are the main areas where expenses often lurk:
- Implementation Resources: Setup is rarely as simple as clicking “install.” You’ll often need IT, consultants, or data engineering support to get BI software running smoothly.
- Ongoing Maintenance: Software updates, backup processes, bug fixes, and adapting to new data sources may require time from your IT or data teams.
- Infrastructure Costs: Don’t forget about the servers or cloud resources needed to host your data, manage scale, or support growing user bases. For example, running your analytics on cloud platforms like AWS or Azure means additional costs for compute and storage. Some on-premises solutions may need dedicated hardware.
- Integration and API Fees: Connecting your BI tool with other systems—like CRM, ERP, or marketing databases—may mean extra costs for special connectors, third-party API calls, or custom integration work.
- ETL/ELT Tools: Transforming and loading data often isn’t built-in. Additional ETL (Extract, Transform, Load) or ELT (Extract, Load, Transform) software or connectors can require licensing and maintenance costs.
- Training and Support: New tools mean users need onboarding, support, and sometimes advanced training. These “soft costs” can add up fast, especially for larger teams.
- Migration and Data Preparation: If you’re moving from one BI solution to another, expect costs for cleaning, transferring, and verifying data quality.
- Ongoing Analysis and Exploration: Labor costs for continual reporting, dashboard creation, and data exploration are easy to ignore, but they are real and can be significant.
- Opportunity Costs: Downtime or lost productivity during implementation or when troubleshooting issues can have real financial consequences.
For example, a mid-sized company might budget $20,000 for annual BI software licensing but later realize it must spend another $8,000 on cloud infrastructure, $5,000 on custom integration, and allocate several weeks of staff time for migration and training. That’s a huge swing in total cost of ownership.

How can you accurately evaluate the total cost of ownership for BI tools?
Simply comparing license prices does not reveal which BI solution is truly affordable or sustainable. You need a total cost of ownership (TCO) approach that considers all costs throughout the lifecycle of the tool. Here’s how to do it:
- List All Hard Costs: This includes software licenses, one-time setup charges, infrastructure (servers, cloud storage, compute power), and required add-ons.
- Add Soft Costs: Factor in staff labor for installation, integration, maintenance, data cleaning, analysis, and ongoing administration. Include required user training, support, and time spent troubleshooting.
- Estimate Opportunity Costs: Consider productivity lost during implementation, potential downtime, or slow report development if a tool has a steep learning curve.
- Plan for Growth: Evaluate scalability costs. Will your BI tool become more expensive as your company, data volume, or user base grows?
- Set a Review Period: Calculate costs over a period, often three or five years, to include anticipated renewals, upgrades, or migration projects.
For a practical BI tools pricing comparison, many organizations build a simple table like this:
| Cost Category | Tool A (Yearly) | Tool B (Yearly) |
|---|---|---|
| License Fee | $15,000 | $10,000 |
| Cloud Hosting | $7,000 | $6,500 |
| Integration & APIs | $2,000 | $3,500 |
| Training | $1,800 | $2,200 |
| Staff Labor | $5,000 | $7,000 |
| Total Yearly TCO | $30,800 | $29,200 |
Even in this simplified example, “cheaper” licenses don’t always lead to lower overall costs. Always use a structure like this to see the real financial impact.
Which pricing models do BI vendors use and how do they affect expenses?
Knowing a vendor’s pricing model is essential for an effective BI tools pricing comparison. Here are the most common approaches you’ll encounter:
- Per-User Licensing: You pay based on the number of users or seats. This can work well for smaller teams but get expensive as you scale.
- Subscription-Based/SaaS: Often a monthly or yearly fee covers software usage, hosting, support, and updates. This is popular for cloud-native BI tools like Tableau Online or Microsoft Power BI.
- On-Premises/Perpetual License: A one-time fee for installing the software on your own servers, with ongoing support and upgrade fees.
- Usage-Based: Billing is based on the volume of data processed, number of queries, or compute resources used. This is common for cloud-first analytics tools like Google BigQuery or AWS QuickSight.
- Tiered Feature Sets: Some vendors segment features—basic analytics may be cheap, but advanced AI, predictive modeling, or collaboration tools require higher-priced tiers.
These models can dramatically alter your budget, especially if your user base or data volume changes over time. Organizations that start small may outgrow a “starter” plan, so it’s smart to look ahead and estimate future needs and costs. For companies investigating Business Intelligence, understanding these models helps avoid unplanned costs as you scale.
What should you ask vendors to reveal all expected expenses?
Not all BI vendors list every possible cost upfront. To avoid surprises, ask direct, detailed questions, such as:
- Are there extra fees for data connectors, API calls, or third-party integrations?
- What does support cost—are premium support or training options extra?
- If you add users or expand data, how does this affect the bill?
- Does implementation require vendor consulting, or can your team manage independently?
- Are there charges for custom dashboards, advanced analytics, or AI features?
- What are the policies and fees for scaling up or down, or for ending your contract early?
These questions help ensure any side costs are on the table from day one. Speaking with AI business intelligence experts or implementation consultants can also shed light on typical vendor practices and possible pitfalls.
How do you compare BI tool pricing for cloud vs. on-premises solutions?
One of the biggest choices you’ll face in a BI tools pricing comparison is whether to deploy in the cloud or on your own hardware (“on-premises”). Both options come with distinct cost structures. Here’s how they usually differ:
- Cloud BI: Lower upfront investment and less in-house maintenance, but recurring subscription costs. Costs rise as storage, compute, or data volumes grow. Easier to scale, but you rely on the vendor’s pricing policies.
- On-Premises BI: High initial outlay for perpetual licenses and hardware. Ongoing costs include support, maintenance, upgrades, and IT labor. Might make sense for organizations with strict data control or compliance needs.
Consider the total spend over three to five years. Some organizations with in-house infrastructure and skills may save with on-premises tools. Others, especially those seeking rapid deployment and flexibility, may find cloud BI more cost-effective even if monthly bills appear higher at first. The right choice depends on your IT resources, security posture, and appetite for ongoing maintenance.
How do soft costs influence overall BI tool value?
Soft costs—such as training, change management, and ongoing user support—can easily be underestimated. While a vendor may quote an appealing license price, your teams may need significant time to adapt, customize, or maintain the software. Experienced organizations often use lessons from previous Business Intelligence Capabilities and Implementation Strategies rollouts to create more realistic cost projections.

What are the most important tips for BI tools pricing comparison?
- Always clarify what’s included and excluded in any quote or proposal.
- Document every category of expense, from user licenses to connectors and cloud storage.
- Speak to current users or industry peers about their real-world experiences and cost overruns.
- Think beyond year one: project costs for three to five years to avoid surprises from renewals or scaling up.
- Use “what-if” scenarios (extra users, more data, adding new features) to test future pricing and budget flexibility.
- Review contracts carefully for lock-in clauses, price increases, or usage thresholds.
By staying methodical and detail-oriented, you’ll have a much clearer view of which BI tool delivers the best value for your investment—not just in year one, but well into the future.
BI tools pricing comparison Q&A: what else should you know?
Q: Why do BI tool costs vary so much between vendors?
A: The main reasons are different pricing models, technology stacks, and service levels. Some vendors bundle infrastructure and support, while others separate these costs. Customization, data volumes, and advanced analytics features also influence expenses.
Q: How important is vendor transparency in pricing?
A: Vendor transparency is crucial. Hidden fees or vague terms can lead to major budget problems later. Always ask for itemized proposals and read the fine print. Speaking with “graduates” of a particular BI platform—current or former users—can reveal issues you might not spot in the contract.
Q: Is there a “best” BI pricing model?
A: There’s no one-size-fits-all answer. Per-user pricing suits smaller teams; usage-based is good for variable workloads; SaaS subscriptions offer predictability and ease. The best fit depends on your team size, data needs, and how you expect your business to grow.
Q: What if your business needs change after deployment?
A: Pick a BI tool and contract that offer flexibility. Look for scalable licenses, modular add-ons, and clear upgrade/downgrade options. Testing how each vendor handles changes before you commit can save you from unexpected costs—and headaches—later.