
Business Intelligence Implementation: 9 Factors That Decide Whether BI Works
Business intelligence implementation is the process of turning operational data into trustworthy reports, dashboards, and analytical tools that people use to make decisions. It involves defining business outcomes, integrating relevant data, agreeing on calculations, implementing access controls, selecting appropriate technology, and establishing a working reporting process.
What matters most in business intelligence implementation?
- Start with the business decisions that need to improve, not a list of dashboards or BI software features.
- Agree on KPI definitions, calculation rules, reporting periods, and business owners before developing shared reports.
- Verify data quality and reconciliation against trusted source records. A technically functioning dashboard can still display misleading information.
- Choose a BI platform that fits the organization’s existing systems, security requirements, skills, and operating budget.
- Measure adoption through recurring business use and decisions, not just report views or the number of licenses purchased.
For operations and finance leaders, the most important question is not which business intelligence platform has the most features. It is what must be agreed before the organization invests in BI software and dashboards.
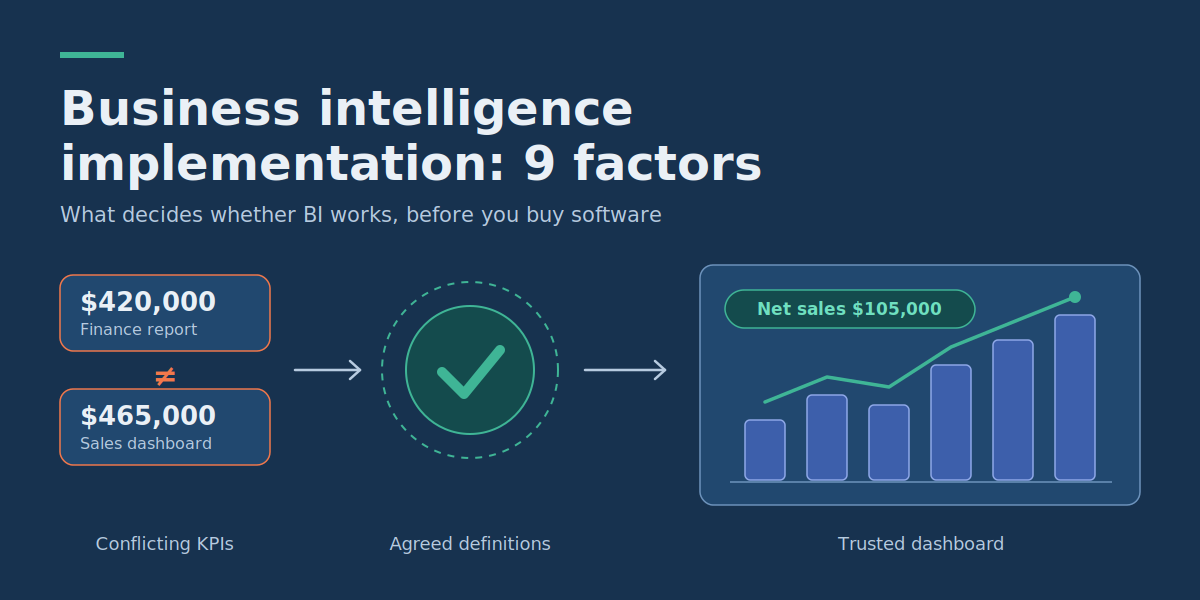
Consider a company where finance reports monthly revenue of $420,000 while the sales dashboard shows $465,000. Both figures may be technically correct under different definitions: one might exclude refunds or use recognized revenue, while the other reflects gross sales booked during the month. Purchasing another analytics platform will not resolve that disagreement.
These nine factors help business leaders evaluate BI implementation readiness, choose what to build first, and avoid dashboards that are technically impressive but commercially unused.
1. Define business outcomes before dashboard requirements
A BI project should begin with a recurring decision that is currently difficult, slow, or unreliable. The dashboard is a means of supporting that decision, not the final business objective.
For example, a finance leader might want to identify which customer groups contribute positively to margin. An operations manager might need to know whether unresolved orders are accumulating faster than employees can process them.
In each case, ask three questions:
- What decision should become easier or more accurate?
- What information is currently missing, delayed, or disputed?
- How will we measure whether the new reporting process improves that decision?
A practical objective could be: “Reduce the time needed to prepare and reconcile the weekly commercial performance report from eight staff hours to three hours or less, while maintaining agreement with approved financial records.”
That statement establishes a baseline, target, and quality condition. It also prevents the team from treating report publication as proof of business value. Microsoft’s Fabric governance guidance recommends aligning governance objectives with business priorities and documenting measurable success criteria. This makes the case for agreeing on outcomes before buying BI tools.
Implementation decision: If the project sponsor cannot identify the decisions the first release must support, postpone tool selection and clarify the business requirements.
2. Create a metric glossary with accountable business owners
Conflicting KPI definitions are among the most consequential problems in business intelligence implementation. A single chart can be technically accurate while still misleading its audience if people interpret its metrics differently.
Common areas of disagreement include revenue, active customers, conversion rates, project profitability, and delivery completion.
For every important KPI, define:
- The business meaning of the metric.
- The exact calculation and relevant filters.
- Included and excluded records.
- The source systems and authoritative records.
- The time period, time zone, and reporting grain.
- The business owner responsible for approving changes.
- The validation method used to confirm correctness.
Worked metric definition worksheet
The following completed worksheet uses a hypothetical retail and services business. It illustrates how three commonly requested metrics can be made unambiguous.
| Field | Net sales | Order completion rate | Active customers |
|---|---|---|---|
| Business meaning | Sales value after discounts and refunds. | Share of eligible orders completed during the reporting cohort’s observation window. | Distinct customers with at least one qualifying completed purchase during the reporting period. |
| Calculation | Gross sales minus discounts and refunded sales. | Eligible completed orders divided by all eligible orders in the cohort, multiplied by 100. | Count of distinct canonical customer IDs with a qualifying purchase. |
| Exclusions | Sales taxes collected on behalf of authorities; cancelled sales not included in gross sales. | Test orders and cancelled orders excluded under the approved eligibility policy. | Test accounts, duplicate customer identities, and purchases later fully cancelled or refunded. |
| Reporting period | Calendar month, using the approved sales reporting time zone. | Monthly order-created cohorts, measured after an agreed completion window. | Calendar month. |
| Primary sources | Approved sales and refund records. | Order management system. | Customer identity and completed-order records. |
| Business owner | Finance controller. | Operations manager. | Commercial lead. |
| Validation | Reconcile totals against the approved financial reporting extract. | Check eligible order counts, completion timestamps, and final status. | Check identity matching and qualifying transactions against representative source records. |
These definitions are illustrative choices, not universal accounting or commercial standards. For example, a company using accrual accounting may need recognized revenue rather than net sales, while another organization may define an active customer through subscriptions or product usage.
Example: calculate monthly net sales
Assume the hypothetical business reports:
| Component | Amount |
|---|---|
| Gross sales, excluding sales tax | $120,000 |
| Discounts | $10,000 |
| Refunded sales | $5,000 |
| Net sales | $105,000 |
The calculation is $120,000 − $10,000 − $5,000 = $105,000. It assumes that refunds are not already deducted from gross sales and that the relevant transactions belong to the agreed reporting period.
If refunds have already been deducted upstream, subtracting them again would understate the result. That is why a written definition must be connected to the actual data transformation logic.
Implementation decision: Require business-owner approval for the definitions of critical KPIs before the reports that use them are accepted.
3. Inventory data sources and establish which records are authoritative
A BI platform can connect to many applications, but connecting systems does not automatically produce consistent information.
A business may hold customer details in a CRM, orders in an ecommerce application, payments in a financial system, and fulfilment events in an operational database. These systems may use different identifiers, update at different times, and store different versions of the same information.
Before designing dashboards, create a focused source inventory.
| Source | Required data | Source owner | Initial concern |
|---|---|---|---|
| CRM | Customer IDs, account ownership, opportunity stages | Sales operations | Duplicate accounts and inconsistent lifecycle stages |
| Order system | Order IDs, dates, statuses, gross sales | Operations | Cancelled and partially fulfilled orders |
| Finance system | Refunds, invoices, payment records | Finance | Timing differences between operational and financial records |
| Support platform | Tickets, resolution dates, customer identifiers | Customer support | Customer matching and historical status changes |
For each important metric, identify which source is authoritative for each relevant fact. A finance system may control recognized revenue, while the order system controls fulfilment status. There does not need to be one physically central database for all information, but the calculation rules must make source responsibilities explicit.
Also identify how records are joined. If customer IDs differ across systems, define a matching process rather than joining loosely on customer names or email addresses without testing for duplicates.
Implementation decision: Do not rely on cross-system dashboards until required identifiers, source responsibilities, and refresh behavior have been verified.
4. Validate data quality before trusting automated reports
Data quality is not a single property. A dataset may contain valid field formats while still being incomplete, stale, duplicated, or inconsistent with the organization’s accounting records.
Priorities quality checks according to what could materially change a business decision.
Five useful data quality checks
| Check | Example test | Failure response |
|---|---|---|
| Completeness | Required order identifiers and dates are populated. | Flag or exclude invalid records according to the agreed rule. |
| Uniqueness | Each source order has one valid canonical order identifier. | Investigate duplicates before aggregating totals. |
| Validity | Order statuses belong to the approved set of values. | Route unknown statuses for mapping or correction. |
| Freshness | The latest successful refresh falls within the required reporting window. | Show the last refresh time and notify the responsible owner. |
| Reconciliation | Monthly net sales matches an approved source calculation. | Hold financial report acceptance until material differences are explained. |
Consider a dashboard showing $105,000 in monthly net sales while the approved finance extract shows $104,500. The difference is $500, approximately 0.48% of the reference figure.
Whether that difference is acceptable depends on the reporting purpose, materiality, timing, and finance policy. A small percentage difference is not necessarily acceptable for audited reporting, and an apparent match may conceal offsetting transaction errors.
A simple pilot might set a provisional reconciliation threshold for prioritizing investigation. The finance owner must decide whether unresolved differences can be accepted for the intended report.
Implementation decision: Document which data quality failures block publication, which require visible warnings, and who is responsible for resolving them.
5. Assign BI ownership and establish workable governance
Governance determines who can define, publish, change, and use shared business information. Without it, different departments may recreate the same KPI using conflicting calculations and distribute reports without a clear owner.
This does not mean every company needs a data governance department. A small business can establish effective controls through a few named responsibilities and documented approval rules. Microsoft’s Fabric governance guidance recommends balancing user empowerment with organizational controls, introducing governance iteratively, and making responsibilities clear.
Minimum practical BI ownership model
| Role | Accountability |
|---|---|
| Executive sponsor | Approves business priorities, funding, and major scope decisions. |
| Business metric owner | Approves the meaning, calculation, and intended use of critical metrics. |
| Data or BI technical owner | Maintains data integration, reporting models, refresh processes, and technical reliability. |
| Data steward or operational owner | Investigates quality exceptions and coordinates corrections with source-system teams. |
| Report owner | Manages changes, user feedback, documentation, and acceptance for a published report. |
These responsibilities can overlap in small organizations. The important requirement is that employees know whom to contact when a figure is disputed, an integration fails, or a metric definition changes.
For more detail on staffing options, see DataColab’s guide to business intelligence team roles Microsoft also describes a BI and analytics Center of Excellence as a way to coordinate expertise, support users, encourage consistent practices, and advance adoption. A formally established team is not essential for every organization; the functions and responsibilities can be distributed among existing employees.
Implementation decision: Every business-critical dataset and report needs an identifiable owner and a documented path for approving changes.
6. Design access and security around real reporting needs
Business intelligence makes information easier to distribute, which also creates a need to control who can see it.
A finance dashboard might include company-wide revenue, department-level margins, and employee compensation information. Those elements do not necessarily belong to the same audience.
For each intended user group, identify:
- Which reports and datasets they may access.
- Whether they may see all records or only an authorized subset.
- Who can change metric definitions or publish reports.
- Whether reports may be exported or shared externally.
- How access is granted, reviewed, and removed.
- Which applicable privacy, regulatory, and contractual requirements must be observed.
Some BI platforms support row-level security and other access controls, but their availability and behavior depend on the product, architecture, and configuration. Do not assume that restricting access to a dashboard automatically protects every underlying dataset or export route.
Test access using representative authorized and unauthorized accounts before rollout.
Implementation decision: A report containing sensitive or restricted information should not be released until its access rules have been approved and tested.
7. Select a BI platform based on fit, not presentation quality
Power BI, Tableau, Looker, and other analytics tools can support business reporting, but their suitability depends on the organization’s requirements and existing technical environment.
A polished product demonstration cannot establish how well a tool handles a company’s real source systems, data model, access requirements, and operating costs.
What to test in a BI software evaluation
| Evaluation area | Practical question |
|---|---|
| Data connectivity | Can the platform connect to required systems through supported, secure interfaces? |
| Metric consistency | Can approved calculations be reused without rebuilding them independently for every report? |
| Security | Can access be restricted appropriately at report and data levels? |
| Performance | Do representative queries and dashboards respond within acceptable times? |
| Refresh and reliability | Can data updates meet the agreed freshness requirements, and can failures be detected? |
| User experience | Can intended users complete the relevant business task without specialist assistance? |
| Cost and support | What will licenses, infrastructure, development, administration, and maintenance cost over time? |
Run a proof of concept using an approved sample of real business data. Ask the prospective platform to reproduce a few agreed KPIs, enforce representative access rules, and demonstrate how a failed refresh is reported.
Not every business needs a new warehouse or extensive analytics architecture. If existing systems and a modest reporting application meet the requirements reliably, that may be the simplest suitable implementation.
If your reporting requirements also depend on custom approvals, operational hand-offs or unsupported system connections, assess whether custom software development for business workflows would address the underlying workflow better than another dashboard.
implementation decision: Choose a platform only after it satisfies the critical workflow and security requirements under realistic testing.
8. Roll out BI in manageable stages and measure actual adoption
A phased BI rollout allows teams to validate calculations, resolve usability problems, and assess whether reports change how decisions are made.
Start with one business process and a limited group of users. A finance reporting pilot, for example, might include the finance controller, two operations managers, and a BI developer.
After the figures have been verified, incorporate the new dashboard into an existing weekly performance meeting rather than expecting staff to adopt another application without a clear reason.
Where employees still assemble weekly reports manually, use the reporting automation benefits and examples as a comparison point for measuring manual preparation time, error correction and repeatability before and after BI rollout.
How should BI adoption be measured?
Dashboard views are a useful activity signal, but they do not establish that the information is trusted or used effectively.
Microsoft’s Center of Excellence guidance identifies mentoring, user education, knowledge sharing and support as core adoption activities. Usage statistics should therefore be assessed alongside whether the reports help people make decisions.
| Adoption measure | Definition | Example use |
|---|---|---|
| Weekly active intended users | Distinct intended users who access the relevant report during the week, divided by the agreed intended-user population. | Identify whether the report reaches its audience. |
| Decision-use rate | Scheduled business reviews in which the report is used to inform an actual decision, divided by eligible reviews. | Establish whether BI has entered the working process. |
| Manual reporting time | Staff time spent preparing, correcting, and reconciling the report. | Measure workload improvement against the baseline. |
| Trusted-report rate | Scheduled report releases that pass the agreed quality and freshness criteria. | Assess reporting reliability. |
| Unresolved metric disputes | Open disagreements about report definitions or results beyond the agreed resolution period. | Identify governance or data-model problems. |
Suppose 15 of 20 intended managers use the dashboard during the week. Weekly active-user adoption is 75%. If only one of four scheduled review meetings actually uses its findings, the decision-use rate is 25%.
That combination suggests the report is being opened but has not become central to the intended management process.
Both figures are hypothetical. They should not be interpreted as industry benchmarks, and the organization should set targets appropriate to the report’s intended audience and review frequency.
Implementation decision: Expand rollout only after the initial audience trusts the reporting output, can use it for its intended purpose, and has a way to report problems.
9. Plan the full cost and long-term support of BI
BI implementation costs include more than software licenses. Source integration, data modelling, quality checks, report development, user training, and ongoing support may account for substantial effort.
Build a cost estimate around the actual scope:
- Initial discovery and KPI definition.
- Source access and integration work.
- Data cleaning and validation.
- Reporting and dashboard development.
- Software licenses, infrastructure, or hosting.
- Security configuration and testing.
- Employee onboarding and support.
- Ongoing maintenance, refresh monitoring, and change requests.
Illustrative first-year BI budget
Consider a hypothetical small-company reporting project covering three source systems, a limited set of approved KPIs, and a single departmental rollout.
| Work item | Illustrative allocation |
|---|---|
| Discovery and metric definitions | $3,000 |
| Integration and data validation | $8,000 |
| BI modelling and dashboard development | $6,000 |
| Security, testing, and training | $3,000 |
| First-year platform and infrastructure allowance | $2,500 |
| First-year support and maintenance allowance | $4,500 |
| Total | $27,000 |
These are constructed planning assumptions, not vendor quotations or typical market prices. The actual cost depends on data complexity, license arrangements, existing internal capacity, security obligations, and the amount of development required.
For a financial justification, compare the total implementation and ongoing costs with measurable benefits. Those benefits might include reporting capacity released, reduced correction work, or an improved operational outcome demonstrated after launch.
Do not automatically assign financial value to every dashboard view. An employee opening a report is not equivalent to a cost saving.
Implementation decision: Approve the project using a documented cost and benefit case, including who will maintain it after the initial developers finish.
BI readiness scorecard: are you ready to implement?
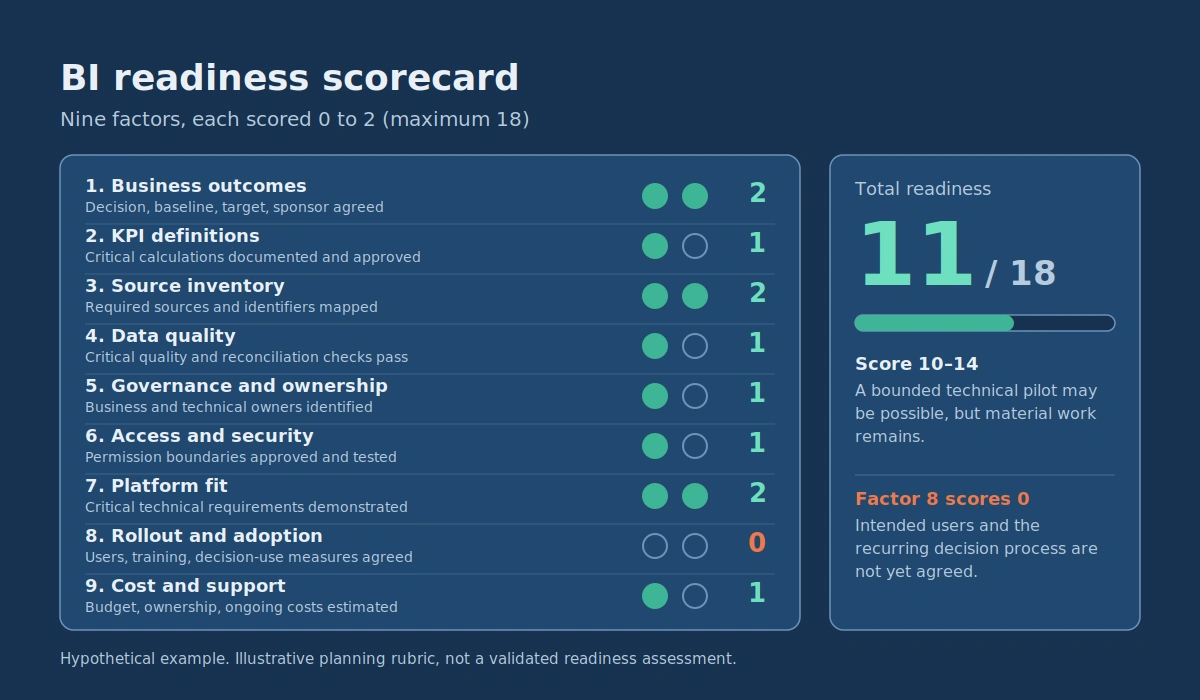
Use this scorecard before committing to a business intelligence platform or full dashboard development. It evaluates the nine factors discussed above.
For each criterion, award:
- 0 points: No reliable evidence or the issue remains unresolved.
- 1 point: Partially addressed, with an owner and a specific next action.
- 2 points: Documented, verified, and approved for the intended pilot scope.
The maximum score is 18. This is an illustrative planning rubric, not a validated industry maturity or readiness assessment.
Completed BI readiness scorecard example
Assume a hypothetical business wants to introduce a commercial performance dashboard. The finance team has identified useful KPIs, but reporting definitions and user adoption arrangements remain incomplete.
| Readiness factor | What must be demonstrated | Example score |
|---|---|---|
| 1. Business outcomes | Decision, baseline, target, and sponsor agreed | 2 |
| 2. KPI definitions | Critical calculations documented and approved | 1 |
| 3. Source inventory | Required sources and identifiers mapped | 2 |
| 4. Data quality | Critical quality and reconciliation checks pass | 1 |
| 5. Governance and ownership | Business and technical owners identified | 1 |
| 6. Access and security | Permission boundaries approved and tested | 1 |
| 7. Platform fit | Critical technical requirements demonstrated | 2 |
| 8. Rollout and adoption | Intended users, training, and decision-use measures agreed | 0 |
| 9. Cost and support | Budget, ownership, and ongoing costs estimated | 1 |
| Total readiness | Maximum 18 | 11 |
How to interpret your readiness score
| Score | Provisional interpretation | Recommended next action |
|---|---|---|
| 0–9 | Important prerequisites are unresolved. | Address business definitions, source access, and accountability before development. |
| 10–14 | A bounded technical pilot may be possible, but material work remains. | Close identified gaps and do not approve operational deployment until critical controls pass. |
| 15–18 | The initiative may be ready for controlled rollout. | Confirm all mandatory gates and run final acceptance tests. |
Do not use the total score to override a critical failure. A project with a high score must still stop if data access is unauthorized, critical financial metrics are unvalidated, or a serious access-control weakness remains unresolved.
In the worked example, the score of 11 indicates that the project should complete its KPI glossary, reconciliation tests, ownership agreements, and adoption plan before broader release.
Factor 8 scores zero because the intended users and recurring decision process have not yet been agreed. That is a warning that the team could build a technically satisfactory dashboard without a clear reason for employees to use it.
First 90 days: BI implementation checklist
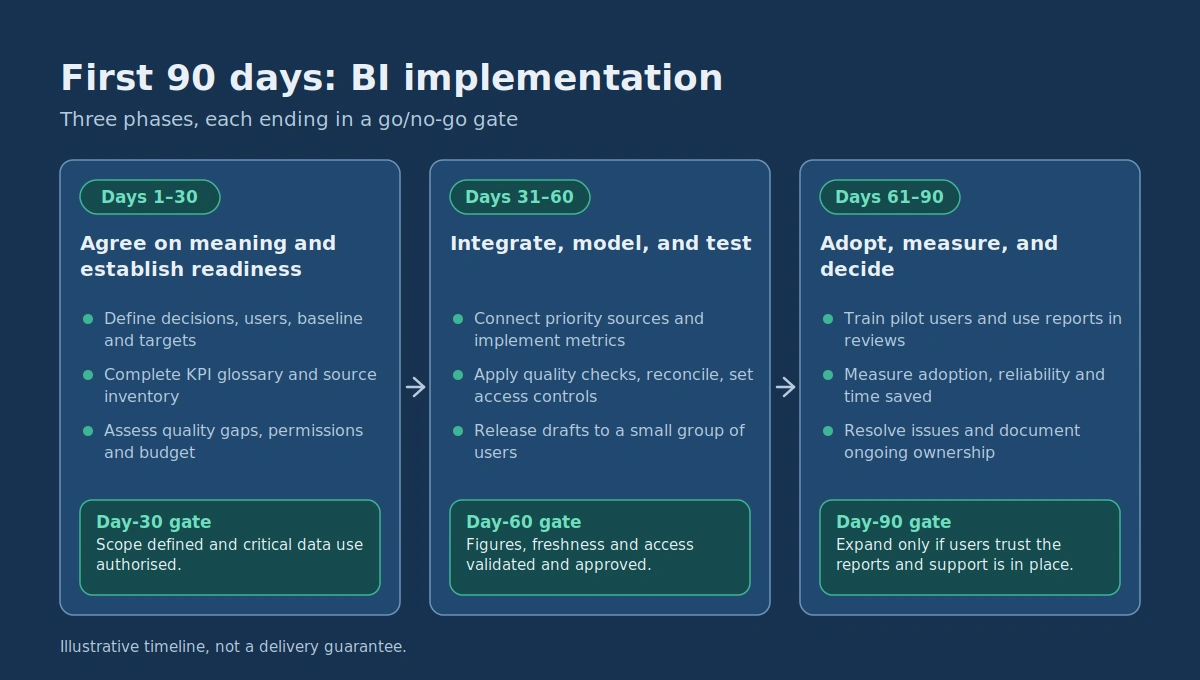
The following implementation plan translates the readiness assessment into a practical first rollout. It assumes the organization has an executive sponsor, approved access to the required systems, and a manageable initial reporting scope.
The timeline is illustrative, not a delivery guarantee. Projects with unresolved permissions, difficult data reconciliation, or complex security requirements may take longer.
Days 1–30: agree on meaning and establish readiness
| Period | Action | Accountable owner | Acceptance criterion |
|---|---|---|---|
| Days 1–10 | Define business decisions, intended users, baseline, and success targets. | Executive sponsor and business lead | Approved objectives and measurable business baseline |
| Days 11–20 | Complete the critical KPI glossary and inventory source systems. | Finance/operations metric owners | Definitions approved; source ownership and required identifiers documented |
| Days 21–30 | Assess quality gaps, required permissions, technical dependencies, and available budget. | Data/BI lead and security owner | Readiness scorecard completed with named owners for open issues |
Day-30 gate: Proceed to the build phase only if the reporting scope is defined, critical data use is authorized, and there is a credible path to validating the required metrics.
Days 31–60: integrate, model, and test
| Period | Action | Accountable owner | Acceptance criterion |
|---|---|---|---|
| Days 31–40 | Connect priority data sources and implement agreed metric calculations. | Data engineer / BI developer | Repeatable data refresh with traceable source records |
| Days 41–50 | Apply quality checks, reconcile calculations, and implement access controls. | Technical owner and business metric owner | Critical validations and permission tests pass |
| Days 51–60 | Release draft dashboards to a small group of intended users. | BI developer and operations lead | Users can complete agreed tasks and identify errors through a documented feedback route |
Day-60 gate: Do not release a report for consequential business decisions until its required figures, freshness, and access permissions have been validated and approved.
Days 61–90: adopt, measure, and decide whether to expand
| Period | Action | Accountable owner | Acceptance criterion |
|---|---|---|---|
| Days 61–70 | Train the pilot audience and incorporate dashboards into existing business reviews. | Business process owner | Intended users can interpret the KPIs and use the report for its defined purpose |
| Days 71–80 | Measure adoption, report reliability, corrections, and operational time saved. | Operations lead and BI owner | Agreed performance indicators measured against the baseline |
| Days 81–90 | Resolve remaining issues, document ongoing ownership, and evaluate expansion. | Executive sponsor and business metric owners | Written decision to expand, revise, or stop the rollout |
Day-90 gate: Expand only if users trust the required reports, the data pipeline operates reliably, the expected business use is demonstrated, and the organization can support the solution after the initial project.
Why do business intelligence implementations fail?
BI failures are not limited to software outages or broken dashboards. A solution can run normally and still fail to produce useful business outcomes.
Common failure patterns include:
- Unclear outcomes: The team delivers reports that do not support a specific decision.
- Conflicting definitions: Departments disagree about how the same KPI should be calculated.
- Unreliable source data: Reports refresh successfully but contain missing, duplicated, or misclassified records.
- No ownership: Nobody can approve changes or resolve reported discrepancies.
- Inadequate security: Reports expose information beyond the intended audience.
- Poor platform fit: Critical integrations or performance requirements prove more difficult than expected.
- Weak adoption: Employees continue using separate spreadsheets or manual processes because the dashboard does not meet their needs.
- Unfunded maintenance: The system works initially but lacks support for new data fields, source changes, and user requests.
Many of these problems cannot be solved by changing the chart type or purchasing more licenses. They require agreement about business definitions, responsibilities, data quality, and operating practices.
Business intelligence implementation FAQs
Who should define KPIs in a BI implementation?
Business owners should approve the meaning and intended use of critical KPIs. Finance typically owns finance-related definitions, operations owns operational performance measures, and commercial leaders own agreed sales or customer measures.
BI developers and analysts translate those definitions into reliable calculations, data models, and reports. They should test the implementation but should not independently decide what a business metric means.
When a KPI crosses departmental boundaries, the relevant owners should resolve differences before publishing a common definition. If agreement is impossible, clearly label distinct metrics rather than silently presenting them as interchangeable.
How much BI governance does a small business need?
Governance should be proportionate to the organization’s scale, information sensitivity, and reporting impact.
A small company may need only an approved metric glossary, named report owners, documented access rules, a basic correction process, and a regular review of important reports.
A larger organization with many departments and self-service analysts may benefit from coordinated standards, shared metric models, central support functions, and a more formal governance structure.
The aim is not to maximize the number of policies. It is to make trusted information easier to use without creating unnecessary risk or operational friction.
What should happen after the first BI rollout?
After a successful pilot, priorities new reporting requests according to their business value, required sources, implementation complexity, and operating cost.
Review the existing dashboards before adding more. Remove obsolete metrics, correct recurring discrepancies, and determine which new information would support a meaningful decision.
New data sources and major metric changes should pass appropriate validation before they affect trusted reports. Keep the ownership and support model up to date as employees and systems change.
A useful BI implementation is maintained as part of the organization’s regular decision-making process rather than treated as a one-off dashboard delivery project.
How long does business intelligence implementation take?
A focused pilot can be organized around the illustrative 90-day plan above, but the actual timeline depends on source-system access, data quality, KPI disputes, security tests and the number of reports involved. Treat each stage’s acceptance criteria as a gate rather than promising a fixed deployment date.
Start your BI implementation with a readiness decision
Before committing to a platform or beginning dashboard development, identify one reporting problem that is worth solving. Agree on the business decision, complete the KPI definition worksheet, and score the nine readiness factors against evidence available today.
Use the first 90 days to resolve critical dependencies, implement a limited reporting workflow, validate the information, and measure whether employees use it effectively.
If your organization needs a realistic BI implementation plan, discuss a scoping workshop with DataColab. Bring one priority reporting decision, a list of current source systems and the most disputed KPIs. The workshop should establish a proposed pilot, responsible owners, validation requirements, risks and an initial budget range before development begins.
Business intelligence implementation succeeds when reliable information becomes part of how the organization operates. A dashboard that looks impressive is useful only when people agree on what its numbers mean, trust the underlying data, and can act on what they learn.
Pingback:Best BI Reporting Tools for Small Teams: Pricing & Setup Compared
Pingback:Data Governance Strategy and Roadmap: A Practical 90-Day Plan
Pingback:BI Team Structure: Roles, RACI & Hiring Order by Size