
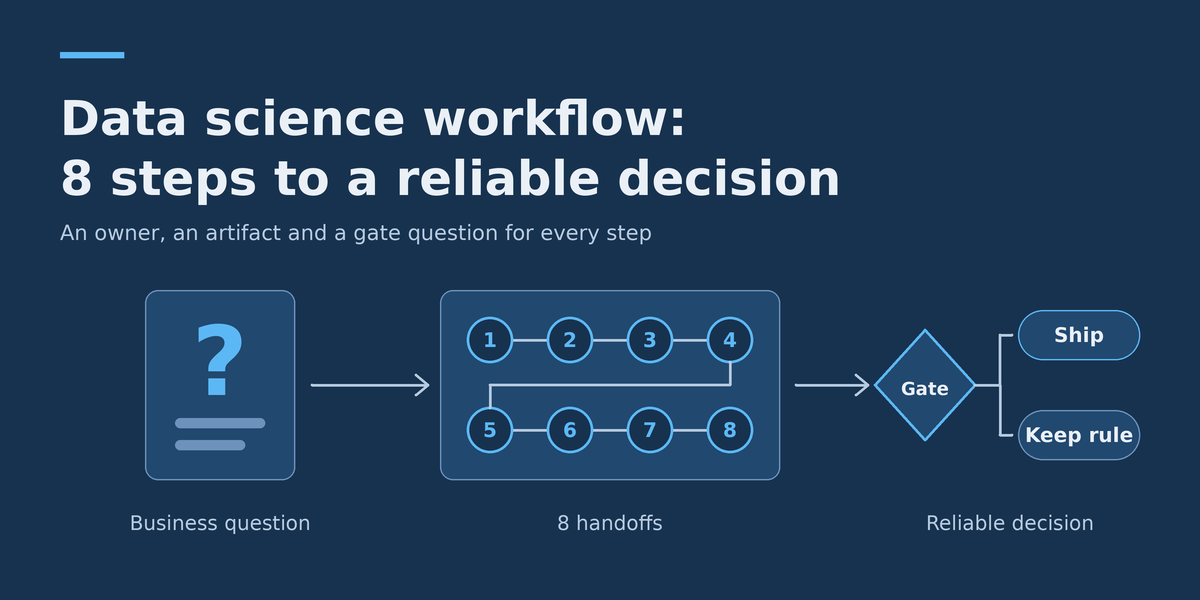
Data Science Workflow: 8 Steps from Business Question to Reliable Decision
A data science workflow is the sequence of steps that turns a business question into a decision people can trust: define the question, collect and validate data, explore it, set a baseline, test a model, deploy it and monitor it. The order is familiar. What usually goes wrong is the gaps between steps, where nobody is sure who owns the next piece of work or what “finished” means.
This guide gives each of the eight steps an owner, a handoff artifact and a gate question, then runs one end-to-end example, labelled hypothetical, so you can see the decision logic with numbers. It is written for product managers and analysts who have to move a question through to a deployed outcome, including those working alongside data scientists and data engineers. Treat the roles as functions rather than job titles: in a small team one person may hold several lanes, but the handoffs still need to happen.
Key takeaways: what matters most in a data science workflow
- A workflow is a chain of handoffs. Each of the eight steps should end with a named artifact that someone else can pick up and check, not just “work done”.
- Most failures start before modelling: a vague question, an undefined target, or data that was never validated.
- A baseline comes before any model. If a simple rule gets most of the value, the model has to justify its extra cost and maintenance.
- Deployment is not the end. Someone must own drift checks and the retrain-or-retire decision, and that person needs to be named before launch.
The 8 steps of a data science workflow at a glance
| Step | Artifact handed off | Gate question before moving on |
|---|---|---|
| 1. Business question | One-page decision brief: decision, metric, target definition, constraints | Would a result change what we actually do on Monday? |
| 2. Collect | Data inventory with sources, owners, refresh schedule, access | Is every field available at the moment the decision is made? |
| 3. Validate | Data quality report and agreed rules | Do row counts, keys, ranges and freshness match what the owners expect? |
| 4. Explore | Findings note with the target defined and features shortlisted | Do we understand what drives the outcome, and what is suspicious? |
| 5. Baseline | Simple-rule score on the evaluation metric | What is the number a model must beat? |
| 6. Test | Evaluation report on held-out later data, with go/no-go recommendation | Does the gain over baseline justify the cost, and does it hold on unseen data? |
| 7. Deploy | Scheduled pipeline, output table, dashboard, runbook | Can the decision-maker use the output without asking the modeller? |
| 8. Monitor | Monitoring dashboard with thresholds and a review date | Who is alerted, and who decides to retrain or retire? |
Running example: an illustrative retention case
To keep the steps concrete, one scenario runs through the whole guide. It is an illustrative example: the company, numbers and results are invented for teaching and are not benchmarks. Assumptions: a regional meal-kit company has about 40,000 active subscribers. Roughly 4% cancel each month, which is about 1,600 a month or around 370 a week. The retention team can phone 400 subscribers a week. The question is who to call.
Step 1: Turn the business question into a decision brief
Start with the decision, not the technique. “Build a churn model” is a method. “Choose the 400 subscribers each week most worth a retention call” is a decision. The brief should say what action follows, what metric defines success, how the target is defined, and what constraints apply (call capacity, privacy limits, how soon the answer is needed). In the example, the target is defined as “cancels within 30 days of the scoring date” and the success metric is the share of the 400 called who would have cancelled anyway. That metric is called precision at 400 here: of the 400 flagged, how many were truly at risk. It matches the real constraint, which is capacity, rather than a generic accuracy score. The decision owner, here the head of retention, signs off on the brief. If nobody can name the action that follows, stop; no later step fixes that.
A brief like this also sits inside a bigger plan. If your team is still deciding which data projects to prioritise, a data strategy roadmap helps you check that the question is worth answering before you commit to the rest of the workflow.
Step 2: Collect data that exists at decision time
List every candidate source, who owns it, how often it refreshes and how you will access it. The key test is timing: a field is usable only if it is available at the moment you would act. Subscription status, delivery history, skip events, support contacts and order value are all available weekly in the example. A cancellation-survey flag is not, because it only exists after someone has already cancelled. This distinction is the heart of what is called data leakage, which the scikit-learn common pitfalls guide defines as using information that would not be available at prediction time when building the model. The same guide notes that leakage produces overly optimistic performance estimates, so a model that looks great in testing can disappoint on genuinely new data. Catch it here, while you are listing fields, because it is far cheaper than discovering it when a model scores suspiciously well. The data engineer leads this step and hands the analyst a data inventory.
Step 3: Validate before anyone explores
Validation is a set of checks written as rules, so they can run again later: row counts within an expected range, unique subscriber IDs, no future-dated events, plausible values, and freshness (did last night’s load arrive?). Record the rules, the failures and what was done about each. The analyst leads, because the analyst is closest to what the numbers should look like, and sends pipeline faults upstream to the data engineer. Do not quietly patch bad data inside a notebook. A fix applied only in one analysis disappears the next time the data refreshes. Keep these rules; Step 8 reuses them as production checks.
Step 4: Explore to understand the target, not to find a story
Exploration answers three questions: how is the target distributed, what separates the groups, and what looks wrong. In the example you would confirm the roughly 4% monthly cancel rate, check how it varies by tenure and plan, and look at how skipped deliveries relate to cancelling. You will also look for fields that seem too good, which are usually leaks. Give the findings note a section of “things I do not trust yet”. Also decide how you will split data for evaluation now: because the model will predict the future, split by time, training on earlier weeks and testing on later ones, rather than shuffling rows. The scikit-learn guide adds a related rule: split into training and test sets first, before any preprocessing. Google’s Machine Learning Crash Course includes a module on datasets, generalization and overfitting that covers preparing data so training and evaluation give high-quality results, and it is worth reading before you evaluate anything.
Step 5: Set a baseline before building a model
A baseline is the simplest approach that could plausibly work, scored on the same metric and the same data as the model will be. Without one, a number like “27% precision” has no meaning. Use at least two: a naive one (random selection) and a rule a sensible operator would use. In the example (all values hypothetical): random selection catches about 4% of the 400 called, so 16 at-risk subscribers. The rule “call those with the most recent skipped deliveries” scores 18%, so 72 at-risk subscribers. Notice what this does to the conversation: the model no longer has to beat nothing, it has to beat a rule that the team could run today in a spreadsheet.
Step 6: Test on later, unseen data and decide with arithmetic
Train a model on earlier weeks and evaluate it on later weeks it has not seen. Any preprocessing, scaling or feature selection must be fitted on the training portion only. The scikit-learn guide’s general rule is to never call fit on the test data, and it recommends a pipeline because it ensures each step is applied to the correct data subset. Overfitting, a model that does well on its training data but poorly on new data, is why a held-out set is not optional. If you want to get from a first model to a tested one quickly, see how to create a machine learning model fast without skipping the baseline and evaluation steps above. Suppose the hypothetical model scores 27% precision at 400, which is 108 at-risk subscribers among those called, compared with 72 for the rule. Whether that is worth shipping depends on three further assumptions:
- If a retention call saves 25% of at-risk subscribers it reaches, the rule saves about 18 per week and the model about 27. The model’s extra value is 9 retained subscribers a week, or 468 over 52 weeks.
- The yearly cost of building, running and monitoring the model should be lower than the value of those 468 retained subscribers. If one retained subscriber is worth more than the cost of building and running it divided by 468, ship it; otherwise keep the rule.
- A single week of 400 calls is a noisy sample. Evaluate across several held-out weeks (for example, eight) and only trust a gain that shows up consistently.
The data scientist leads this step and writes the go/no-go recommendation. The decision owner makes the call. If the gain is small or inconsistent, the right outcome is a documented “keep the rule”, and that counts as a successful workflow run.
Step 7: Deploy so the decision-maker can act without you
Deployment means more than hosting a model. It covers a scheduled job that builds features the same way it did in training, writes scored output to a table, and surfaces it where the retention team works. In the example that is a weekly list of 400 subscribers with the top reasons each was flagged, plus a short runbook: when the job runs, what to do if it fails, who to contact. The data engineer leads; the data scientist consults on feature logic and the product manager checks that the output matches the brief. A common failure is training-serving skew, where features are calculated one way in the notebook and another in production. The scikit-learn guide makes the same point: if data transforms are used in training, they must also be used on data in a production system, otherwise the feature space changes and the model cannot perform effectively. Reduce the risk by sharing the same feature code between both and by comparing a sample of production scores with an offline recomputation on the same day.
The weekly output table and dashboard are also a reporting job. Automating that refresh removes manual work and keeps the numbers fresh; see these reporting automation benefits and examples for what that can look like in practice. Google’s Machine Learning Crash Course also has a module on production ML systems that covers the components around a deployed model.
Step 8: Monitor, and name who checks drift
Monitoring has three layers. First, pipeline health: did the data arrive, on time, with the expected schema? This reuses the Step 3 rules. Second, input drift: have feature distributions moved away from what the model was trained on (for example, a new promotion changes skip behaviour)? Third, outcome quality: is the model still catching at-risk subscribers? The third layer has a delay built in. In the example the target is a 30-day outcome, so you cannot measure true precision until a month after each list is produced. Until then, drift checks and call-team feedback are your early-warning signals. Agree thresholds in advance, such as “investigate if the weekly share of flagged subscribers with no deliveries in the past four weeks changes by more than a set amount”. Who checks drift? The data scientist or ML engineer who owns the model owns drift and quality; the data engineer owns freshness and schema alerts; the decision owner decides whether to retrain, adjust the process or retire the model, using a review date set at launch.
Data science workflow swimlane: who does what at each step
This grid is a text version of a swimlane diagram. Read across a row to see how the step is split between roles; read down a column to see one role’s load. “Leads” does the work, “Reviews” checks it, “Consults” gives input, “Signs off” accepts the result.
| Step | Product manager | Analyst | Data engineer | Data scientist / ML engineer | Decision owner |
|---|---|---|---|---|---|
| 1. Business question | Leads | Consults | – | Consults on feasibility | Signs off |
| 2. Collect | Reviews scope | Consults on definitions | Leads | Consults | – |
| 3. Validate | – | Leads | Fixes upstream faults | Reviews | – |
| 4. Explore | Consults | Leads | – | Reviews | – |
| 5. Baseline | Reviews | Leads the rule baseline | – | Reviews | – |
| 6. Test | Consults | Reviews | – | Leads | Signs off go/no-go |
| 7. Deploy | Reviews | Builds dashboard | Leads | Consults | Accepts for use |
| 8. Monitor | Reviews monthly | Reviews dashboard | Leads on freshness and schema | Leads on drift and quality | Signs off retrain or retire |
To adapt it, replace the role names with real people, delete lanes you do not have, and merge steps for small projects. Do not delete the sign-off column; if nobody can sign off, nobody owns the decision.
Data science workflow checklist: from dataset to dashboard
Use this before calling a project finished. Each item should be answerable with a document, a query or a screenshot, not a verbal “yes”.
- The decision brief names the action, the metric, the target definition and the decision owner.
- Every field is marked as available or unavailable at decision time, and unavailable ones are removed.
- Each source has an owner, a refresh schedule and an access method.
- Validation rules are written down, automated and have a log of failures.
- The evaluation split respects time, and preprocessing is fitted on training data only.
- At least two baselines are scored on the same data and metric as the model.
- The comparison covers several held-out periods, with the cost-versus-value arithmetic shown.
- The scheduled job builds features with the same code as training, and a sample is compared against an offline recomputation.
- The output table has a plain-language data dictionary, and the dashboard states the scoring date and data freshness.
- The runbook says what to do when the job fails, who to contact and how to roll back.
- Drift and quality thresholds, alert owners and a review date are agreed and recorded.
- The retrain-or-retire decision rule names the person who makes it.
When the data science workflow needs to bend
Real projects loop. A finding in Step 4 may send you back to Step 2 for a missing field, and a failed Step 6 may mean going back to Step 1 because the question was too ambitious. That is expected. What matters is that you go back deliberately, with the loop recorded, rather than pushing a weak result forward. For some problems, a full model is the wrong answer: if the baseline already performs well, or the decision happens too rarely to learn from, or no one will act on the output, the useful deliverable may be a validated dashboard or a rule. Steps 1 to 5 still earn their keep in that case. If you are weighing up a build or integration like this and want to talk through how the handoffs would work for your data, DataColab is happy to discuss the project with you.
Pingback:Free Online Data Science Bootcamps: Courses & Learning Plan