
Best BI Reporting Tools for Small Teams: Setup, Pricing and Practical Fit
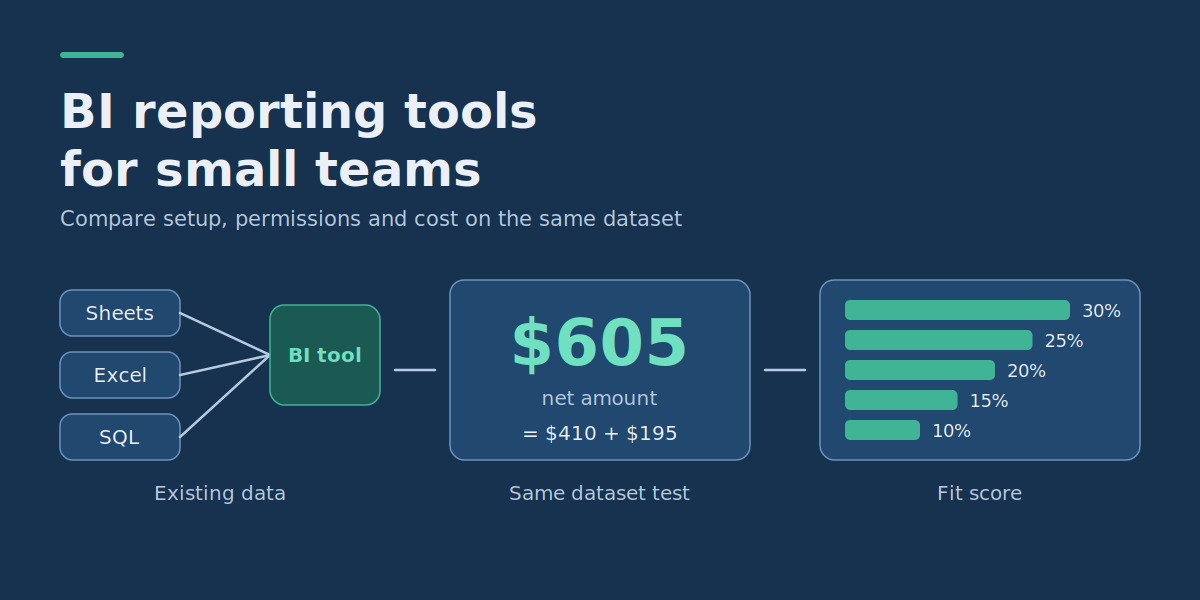
The best BI reporting tools for small teams are the ones that connect to your existing data, produce a correct first dashboard, enforce the right access permissions and stay affordable to run. An inexpensive license is not much use if integrating your accounting system turns into a custom development project, or if the platform cannot safely share data with the people who need it.
Instead of ranking products by chart count or advertised features, this guide compares six tools by the practical work involved in getting a reporting system running: data preparation, first-dashboard setup, sharing permissions, recurring fees and ongoing maintenance. It also includes a free test dataset, a scoring worksheet and a worked pricing example.
Which BI reporting tool should a small team choose?
- Google Data Studio (formerly Looker Studio): A practical starting point for teams already using Google Sheets, Google Analytics or other supported Google data sources. Its standard reporting tier is free.
- Microsoft Power BI: Worth evaluating when reporting depends on Excel, Microsoft services, relational databases and structured analytical models. Sharing involves licensing and permission considerations.
- Zoho Analytics: A candidate for small operations teams that want cloud reporting, application integrations and packaged user-based plans.
- Metabase: Particularly relevant when reporting data already sits in a supported database and you want a visual query builder alongside SQL.
- Tableau Cloud: An option for teams that need deeper analytical exploration and visualization, provided the licensing and administrative requirements fit the budget.
- Apache Superset: Worth considering when technically capable teams prefer an open-source, SQL-oriented BI platform and can maintain the deployment.
Vendor features and US-dollar list prices below were checked against official vendor pages on October 16, 2026. Prices vary by country, subscription terms and configuration, so confirm the current quote before purchasing. The setup assessments are requirements-based comparisons, not claims that the vendors were independently benchmarked for speed.
What matters most when comparing business intelligence tools?
Small teams usually need a modest number of reliable reports rather than an entire enterprise analytics environment. Before choosing software, identify how many datasets, report creators and viewers are involved, which calculations must stay consistent and who will maintain the setup.
1. Connection to existing data sources
Start with the systems that already hold the information. A company using Google Sheets and Google Analytics has a different integration problem from one that must combine an on-premises accounting database with a CRM.
Ask whether the platform offers a supported connection, what permissions it requires, whether scheduled refresh is available and whether the connection adds licensing or processing charges.
A supported connector is not the same as a completed integration. Data may still need deduplication, normalization, field mapping and reconciliation.
2. Effort required to build the first dashboard
Measure setup effort from access to the data source through to a dashboard that shows correct numbers and can be shared with its intended users. That includes:
- Configuring the data connection.
- Preparing the reporting dataset.
- Defining metrics and date fields.
- Building the first usable visualization.
- Validating results against source records.
- Configuring and testing user permissions.
A vendor demonstration may make chart creation look instant, but it rarely measures the work of resolving inconsistent customer identifiers, incorrect dates or incomplete financial transactions.
3. Reporting permissions and data security
A business dashboard may contain financial data, customer records or department-specific information. The tool must enforce the appropriate access rules across reports and underlying data. Consider whether users need:
- View-only access to particular dashboards.
- Permission to create or modify reports.
- Restrictions on particular datasets or columns.
- Row-level restrictions by region, department or customer.
- Controls over exports and external sharing.
Do not assume that hiding a chart, applying a visual filter or making a link hard to guess protects the underlying information.
4. Total cost beyond the advertised subscription
Recurring cost can include report creators, viewers, hosting, data warehouse queries, paid connectors, refresh infrastructure, storage, maintenance and support. A zero-cost license may still require an engineer to operate the system, while a paid cloud service may reduce the infrastructure the team has to maintain.
5. Technical skills available inside the business
A team comfortable with SQL and databases can consider products that need more technical configuration. A nontechnical operations department may do better with a managed reporting service, provided its data sources are supported.
The best tool is not necessarily the one with the most powerful analytical engine. It is the one your organization can use and maintain without depending on expertise it does not have. For related preparation, see DataColab’s guide to business intelligence key implementation factors.
BI reporting tools compared: setup, permissions and practical fit
This comparison emphasizes the work needed to make a first report usable. Setup descriptions are conditional assessments based on documented product capabilities, not measured installation times.
| Tool | Most suitable starting situation | First-dashboard work | Permissions to investigate | Main trade-off |
|---|---|---|---|---|
| Google Data Studio | Reports based on Google services, Sheets or supported cloud connectors. | Connect the source, confirm field types, define metrics, build charts and configure sharing. | Report sharing, data-source credentials and viewer access to underlying information. | External connector charges, data-source complexity and governance needs can outweigh the free reporting license. |
| Microsoft Power BI | Excel, Microsoft-oriented environments and businesses needing reusable analytical models. | Import or connect data, transform fields, define measures, publish and configure sharing. | Workspace roles, semantic-model permissions, row-level security and user licensing. | Data modeling, refresh configuration and sharing requirements add work beyond desktop report creation. |
| Zoho Analytics | Cloud-oriented small businesses using spreadsheets, databases or supported business applications. | Import or connect data, prepare metrics, generate reports and invite permitted users. | Workspace and report access, user roles, viewer plans and applicable fine-grained controls. | Plan limits, data capacity, refresh behavior and integration scope must be checked. |
| Metabase | Teams with accessible relational databases and repeatable operational questions. | Connect a database, configure data access, create a query-builder question and assemble a dashboard. | Database permissions, collections and paid-plan row/column security where required. | Self-hosting creates operational responsibility; advanced controls can require a much higher paid tier. |
| Tableau Cloud | Teams needing extensive visual exploration with a budget for authoring and viewing licenses. | Prepare the source, establish data relationships, create views, publish and configure access. | Creator, Explorer and Viewer licenses, content permissions and data-access rules. | Annual licensing and analytical preparation may be disproportionate for a handful of routine reports. |
| Apache Superset | Technically capable teams reporting from supported SQL data platforms. | Deploy the application, configure database drivers, connect sources and build charts and dashboards. | Authentication, roles, database access and configured row-level restrictions. | No license fee for self-hosted open-source software, but infrastructure and operating responsibilities remain. |
These tools are not identical products at different prices. Their architectures, deployment options and governance capabilities differ. Shortlist products that fit your actual systems rather than reading this table as a universal ranking.
Best BI reporting tools: individual strengths and limitations
1. Google Data Studio: for reporting built around Google-connected data
Google Data Studio, previously named Looker Studio, provides browser-based report creation, charts, filters and sharing. Google documents support for Google Sheets, Google Analytics, BigQuery and numerous other data connectors. The self-service reporting tier is listed at no charge for creators and viewers, while Data Studio Pro adds organization-oriented administration, team content management and support.
When it fits: A small marketing or operations team already keeps clean reporting data in Google Sheets or another supported source and wants to share a modest set of dashboards.
What setup involves: Establish an authorized data connection, confirm numerical and date fields, define calculated metrics where necessary, build report components and choose the correct sharing and credential settings.
What to verify: Data-source credentials matter most. Google distinguishes between owner’s credentials, viewer’s credentials and service-account credentials. With owner’s credentials, viewers may see report data through the owner’s authorization without having access to the underlying data source. That is useful for controlled sharing, but the report owner must understand exactly what becomes visible.
Data Studio is distinct from the broader Looker enterprise platform, so a free report should not be assumed to include every Looker capability.
2. Microsoft Power BI: for structured business reporting and Microsoft-oriented teams
Power BI supports data preparation, analytical modeling, interactive visualizations and sharing through the Power BI service. For many businesses, its strength is the ability to build reusable analytical models across spreadsheets, databases and supported application sources.
When it fits: The company already works extensively with Excel, Microsoft services or relational data and needs repeatable financial or operational reporting.
What setup involves: Connect data through Power BI Desktop or supported service workflows, clean and transform information, define calculations, publish to an appropriate workspace and configure access and refresh.
What to verify: Do not confuse the free authoring experience with licensed organizational sharing. Microsoft distinguishes between a free account, Pro, Premium Per User and capacity-based options, so count every creator and consumer before choosing a plan.
For modeling and security decisions, Microsoft’s Power BI guidance documentation is a useful reference. It collects best-practice material from the team that builds Power BI and from people who work with its enterprise customers. It includes dedicated articles on star schema design and row-level security, plus implementation-planning topics such as workspaces and security. Its migration guidance also recommends gathering requirements and running a proof of concept before deployment, which is the same logic as the shared-dataset test later in this guide.
Hiding a field or visual is not a substitute for enforcing access to the underlying data.
3. Zoho Analytics: for cloud reporting across small-business applications
Zoho Analytics offers hosted reporting, data imports, application connectors, dashboards and sharing. Its feature comparison lists support for files such as CSV and Excel, cloud drives and various database sources.
When it fits: A small business needs reports across supported operational applications and prefers a managed service over running its own BI server.
What setup involves: Import a dataset or configure a connector, check inferred column types, define the necessary metrics, create reports and grant access to intended users.
What to verify: Zoho’s plans set different user, row and feature limits, and additional viewers, users, storage and advanced requirements can raise the cost. Also confirm that your particular operational application supports the fields and refresh process you need. A listed connector does not guarantee that every object and metric is available in the form your business expects.
4. Metabase: for teams with SQL databases and operational reporting needs
Metabase supports interactive dashboards, a graphical query builder and SQL queries. The open-source edition can be self-hosted, while paid hosted and self-hosted offerings add capabilities and support.
When it fits: A technical team already maintains relevant data in PostgreSQL, MySQL or another supported database and wants operational dashboards without building a reporting interface from scratch.
What setup involves: Connect the database with appropriate credentials, configure access, create saved questions and combine them into dashboards. Creators can use the visual query builder for many tasks without writing SQL, though complex data preparation may still need SQL or engineering support.
What to verify: Metabase’s row and column security requires the Pro or Enterprise plan, and native SQL permissions can bypass query-builder row and column restrictions. For teams with sensitive department-specific data, the difference between basic permissions and advanced data isolation can change which plan is suitable.
Self-hosting removes proprietary licensing charges for the open-source edition but adds server maintenance, upgrades, backups and security responsibilities.
5. Tableau Cloud: for teams requiring broader analytical exploration
Tableau Cloud provides hosted analytics with different license roles for people who create, explore or consume reporting content.
When it fits: The organization needs flexible visual analysis, has capable report creators and is willing to pay for a more substantial analytical environment.
What setup involves: Connect and prepare datasets, define relationships and calculations, build the visualizations, publish content and assign suitable user roles.
What to verify: Every Tableau Cloud deployment requires at least one Creator license, and other users may need Explorer or Viewer licenses depending on their tasks. For a small team that needs one operational summary from a spreadsheet, the extra capability may not justify the subscription and setup effort. Where analytical exploration is a core part of the job, it may be well worth it.
6. Apache Superset: for technically managed, SQL-based reporting
Apache Superset is an open-source data exploration and visualization platform with a SQL editor, chart-building interface and configurable security features.
When it fits: A business has technical capacity, already uses a supported SQL database or analytical engine and wants to operate its own reporting platform.
What setup involves: Deploy and secure the application, install or configure database drivers, connect data sources, configure users and permissions, then build dashboards.
What to verify: An open-source license does not cover hosting, database resources, backups, upgrades or engineer time. Superset may suit an existing technical team but be unnecessarily demanding for an operations department with nobody available to maintain it.
BI reporting tools pricing comparison (October 16, 2026)
The following are published vendor list prices checked on October 16, 2026, in US dollars where available. They are not quotations for a specific business, and regional pricing, taxes, discounts and contract terms may differ. Always confirm against each vendor’s current pricing page before buying.
| Tool | Published starting price | Billing or capacity consideration |
|---|---|---|
| Google Data Studio | $0 for standard creators and viewers. | Data Studio Pro lists $9 per user per Google Cloud project per month; subscription terms can affect pricing. |
| Microsoft Power BI | Pro: $14 per user/month. | Paid yearly; Premium Per User lists $24 per user/month. Capacity and eligible existing Microsoft licenses can change the total. |
| Zoho Analytics | Basic: $24/month, billed annually. | Basic starts with two users and 0.5 million rows. Standard lists $48/month billed annually, starting with five users and 1 million rows. |
| Metabase | Open Source: $0 license; Starter: $100/month. | Starter includes five users. Pro lists $575/month with ten included users on monthly billing. Annual terms and extra users have different rates. |
| Tableau Cloud | Standard Creator: $75 per user/month. | Standard Explorer: $42 and Viewer: $15 per user/month; annual contract and annual billing required. |
| Apache Superset | $0 open-source software license. | Hosting, database usage, support and internal administration are additional responsibilities and costs. |
These prices describe different licensing structures. Comparing them as though each buys the same number of users, security features and operational services would be misleading.
Worked pricing example: five internal reporting users
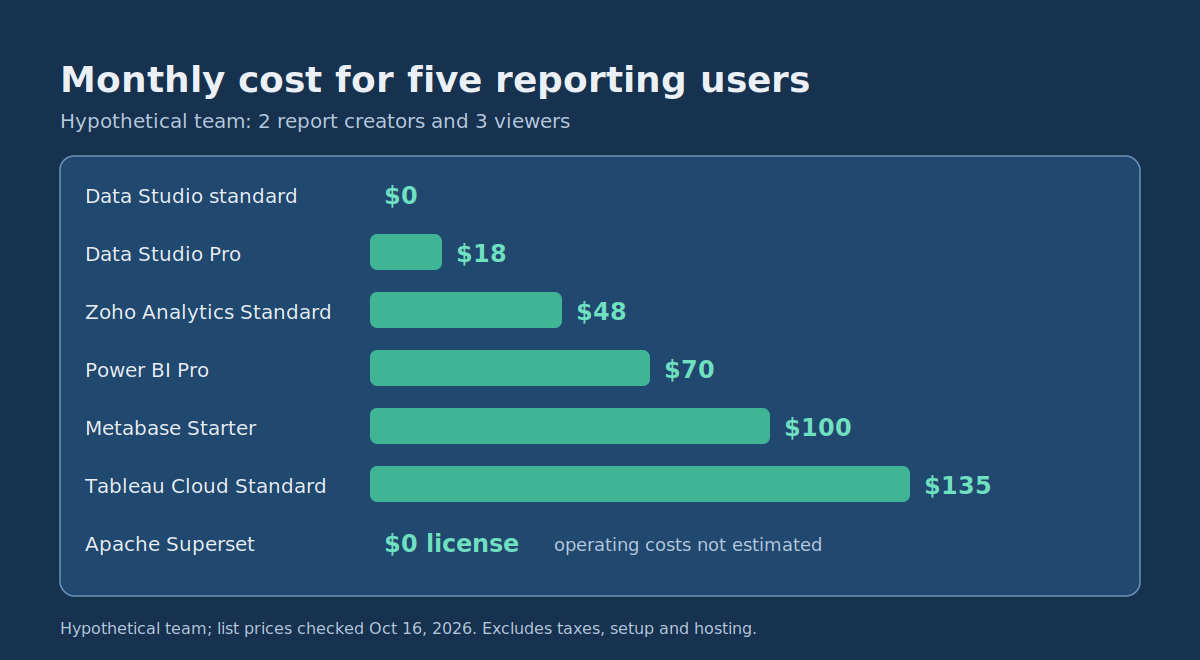
Assume a hypothetical business with five reporting users: two who create or manage reports and three who mainly view them. All reporting is internal, with no customer-facing embedded analytics. The figures exclude taxes, implementation, premium connectors, storage, infrastructure, support add-ons and discounts.
| Candidate setup | Licensing assumption | Illustrative monthly equivalent |
|---|---|---|
| Data Studio standard | Two report creators and three viewers on the no-charge tier. | $0 platform licensing. |
| Data Studio Pro | Two Pro users managing reports in one project; three report-only viewers without Pro features. | $18 at the listed $9 rate. |
| Power BI Pro | Five paid Pro users at $14 each, with no qualifying included licenses. | $70, paid under an annual arrangement. |
| Zoho Analytics Standard | One Standard plan covering the five named users. | $48, billed annually. |
| Metabase Starter | Five users within the included allocation. | $100 on monthly billing. |
| Tableau Cloud Standard | One Creator at $75 and four Viewers at $15, assuming only one person needs Creator capabilities. | $135, billed annually. |
| Apache Superset | Self-hosted open-source deployment. | $0 license; operating costs not estimated. |
The Tableau line assumes one Creator because only one user needs full authoring duties. If both report creators need Creator capabilities, the license cost rises, so match license roles to the tasks each employee actually performs.
This example also does not show which option is cheapest overall. A free reporting tier connected through an expensive third-party data service may cost more to run than a paid tool with a suitable native connector.
Hands-on BI comparison: test every tool with the same dataset
The most useful way to compare setup effort is to give each shortlisted product the same reporting task, input data and acceptance criteria. The synthetic dataset below is small enough to copy into a CSV file or spreadsheet. It contains no customer information and is designed to expose common errors involving status filtering, negative refund values, monthly grouping and regional totals.
Sample dataset: small-business order events
Save this content as orders_sample.csv, or paste the rows into a spreadsheet using the column names shown.
order_id,order_date,region,status,amount_usd
A001,2026-09-03,North,Paid,120
A002,2026-09-05,South,Paid,80
A003,2026-09-07,North,Refund,-30
A004,2026-09-08,South,Pending,200
A005,2026-09-12,North,Paid,150
A006,2026-09-15,South,Paid,90
A007,2026-10-02,North,Paid,75
A008,2026-10-04,South,Refund,-20
A009,2026-10-05,South,Paid,140
All nine rows are fictional and represent simplified order and refund events in one currency, not a complete accounting model. For this test, a refund is a negative adjustment, and pending orders must not contribute to the metric.
Metric definition and expected results
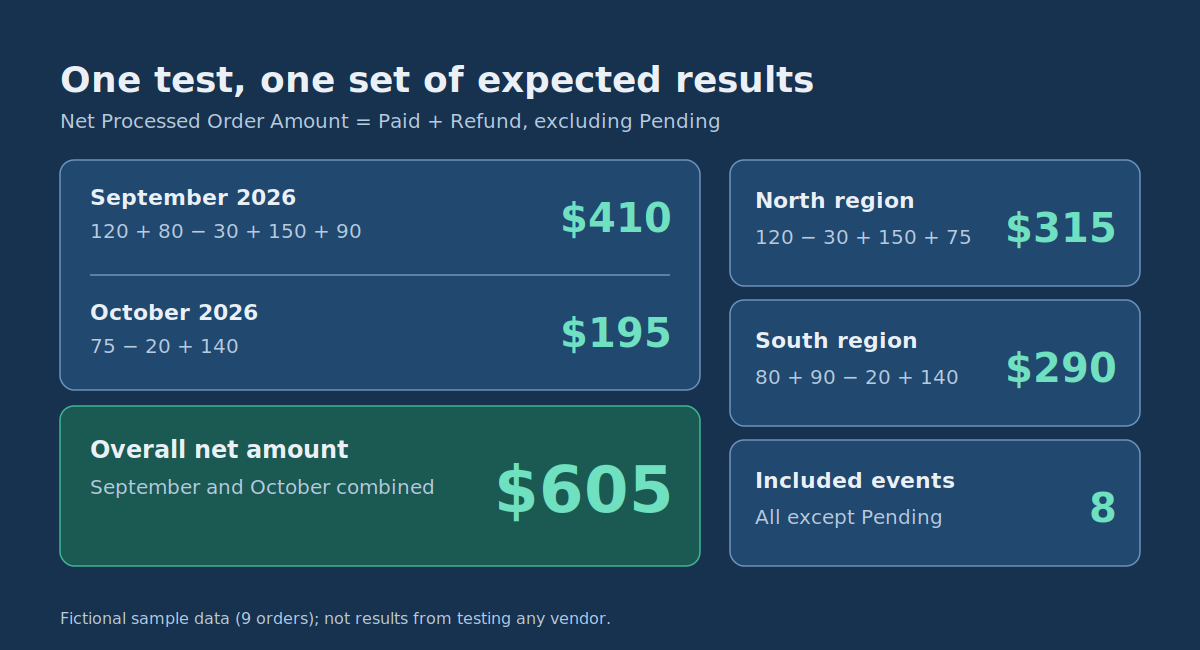
Define the metric as Net Processed Order Amount = sum of amount_usd for Paid and Refund records, excluding Pending records. Use the first seven characters of order_date to group by calendar month, or derive an equivalent year-month dimension from a date field.
| Check | Expected result | Explanation |
|---|---|---|
| September 2026 | $410 | 120 + 80 – 30 + 150 + 90 |
| October 2026 | $195 | 75 – 20 + 140 |
| North region | $315 | 120 – 30 + 150 + 75 |
| South region | $290 | 80 + 90 – 20 + 140 |
| Overall net amount | $605 | September and October combined |
| Included events | 8 | All records except the Pending event |
These are verified arithmetic expectations on the synthetic records, not results from testing the named BI vendors.
Reference SQL for checking the metric
If your data is available as an SQL table named orders, this query calculates the metric using syntax compatible with SQLite and PostgreSQL for text-format dates:
SELECT
    substr(order_date, 1, 7) AS report_month,
    SUM(amount_usd) AS net_processed_amount
FROM orders
WHERE status IN ('Paid', 'Refund')
GROUP BY substr(order_date, 1, 7)
ORDER BY report_month;
Expected result:
report_month | net_processed_amount
-------------|---------------------
2026-09      | 410
2026-10      | 195
With a native date type, adapt the date expression to your database’s date functions. Do not assume this simplified event metric represents formally recognized revenue.
Perform the same dashboard test in each shortlisted tool
- Load the dataset. Import the CSV or make the records accessible through a supported database connection. Record whether a connector, database import or intermediate storage step was necessary.
- Verify column types. Ensure the date is interpreted consistently, the amount is numeric and status and region are text categories.
- Define the metric. Include Paid and Refund statuses while excluding Pending. Do not remove negative refund adjustments.
- Create the first visualizations. Build a monthly comparison, a regional comparison and a single overall net amount.
- Check the totals. Confirm $410 for September, $195 for October, $315 for North, $290 for South and $605 overall.
- Configure report sharing. Give an intended viewer the minimum access required and confirm they see the correct authorized report.
- Test a data update. Modify a synthetic record or add a test event, run the required refresh and confirm the result updates.
- Record the actual effort. Measure the time, technical steps, errors and assistance needed to reach a verified shared dashboard.
If a candidate cannot accept the CSV directly, document the extra import or database step. That additional integration work is part of the comparison, not a reason to silently change the test. The sample establishes calculation correctness and basic usability; it does not establish performance on large datasets, production concurrency or sensitive-data access policies.
How to measure first-dashboard setup effort fairly
Published setup estimates are hard to compare because starting conditions differ. A demo using a clean file is not the same workload as connecting an accounting database with restricted access. Use this repeatable trial log for each tool.
| Trial stage | Measurement | Completion condition |
|---|---|---|
| Account or environment preparation | Elapsed time and required administrator involvement. | Authorized users can access the reporting environment. |
| Data connection | Elapsed time, connector cost and technical interventions. | All nine synthetic records are accessible. |
| Model and metric setup | Elapsed time and whether SQL or another calculation language is needed. | Required dates, categories and net amount calculation are correct. |
| Dashboard creation | Elapsed time and unresolved usability problems. | The monthly, regional and total views are readable. |
| Reconciliation | Elapsed time and number of corrections. | All expected results match. |
| Permission configuration | Elapsed time and any license changes required. | The intended viewer can access the report without unnecessary privileges. |
| Refresh test | Elapsed time, manual steps and failures. | An approved data change becomes visible through the intended refresh method. |
Start timing when the necessary source access and trial environment are available, or record the time needed to obtain them separately. Use the same definition across candidates, and never report a single “minutes to first dashboard” number without saying which stages it includes. For many small businesses, access approval and preparing correct data take more work than arranging charts.
BI tool selection worksheet: score fit, not popularity
This weighted evaluation helps small teams compare vendors against their actual requirements. It gives more weight to integration and access control than to cosmetic visualization differences. Score each criterion from 0 to 2:
- 0 (requirement not met): The tested configuration cannot satisfy the requirement, or has a significant unresolved problem.
- 1 (partially met): The requirement can be satisfied only with extra work, restrictions or material trade-offs.
- 2 (met): The requirement is demonstrably satisfied in the proposed configuration.
Weighted BI tool-fit worksheet
| Criterion | Weight | Evidence to collect |
|---|---|---|
| Data-source and integration fit | 30% | Supported connections, required data preparation, refresh behavior and connector dependencies. |
| Permissions and governance | 25% | Successful authorization tests and required controls within the chosen plan. |
| First-dashboard effort | 20% | Measured setup time, technical steps, corrections and administrator involvement. |
| Ongoing ownership cost | 15% | Relevant subscriptions, hosting, connectors, maintenance and support. |
| Fit with available team skills | 10% | Can the designated team operate, modify and troubleshoot the setup? |
Weighted score = sum of (criterion weight × score ÷ 2). The maximum is 100. The weights are suggested planning priorities, not an industry standard, so adjust them before evaluating candidates if your needs differ.
Worked example: two hypothetical trial results
Suppose a small operations team has completed its own trial of two unnamed configurations, Candidate A and Candidate B. The scores below are invented to demonstrate the calculation and are not assessments of any vendor in this article.
| Criterion | Weight | Candidate A score | Candidate B score |
|---|---|---|---|
| Data-source fit | 30% | 2 | 1 |
| Permissions and governance | 25% | 2 | 2 |
| First-dashboard effort | 20% | 1 | 2 |
| Ongoing ownership cost | 15% | 1 | 2 |
| Team skills | 10% | 2 | 1 |
| Weighted total | 100% | 82.5 / 100 | 80 / 100 |
Candidate A scores 82.5 because stronger integration and skill fit outweigh weaker setup and recurring-cost scores under these weights. Candidate B is easier to configure and cheaper to run in this fictional evaluation but needs more integration work. A gap this small is not a precise measure of superiority, so review the evidence and check whether different weights would change the decision.
Important: the weighted score must not override mandatory requirements. If a tool cannot enforce essential access restrictions or connect to the required data source within your approved architecture, it should fail regardless of its other advantages.
What recurring costs should a small BI team budget for?
License prices are only one component of total cost. A sound business case includes the effort required to keep reports correct, accessible and current.
Integration and data processing
Some applications offer convenient connectors but need an additional service or paid connector for particular data sources. Query charges, database capacity, data transfer and storage may also apply when the platform reads from an external cloud data warehouse. Check these dependencies independently of the BI license.
If your systems have no usable connector at all, the real choice may be between a workaround and a purpose-built integration. In that case, custom software development for business workflows can be a more reliable foundation than forcing a tool to fit.
Report creators and viewers
Products charge differently for users who build reports, explore existing reports or only view results. Count named users by their actual tasks. A business with two authors and 30 viewers may have a different best-fit license from one with 20 analysts who all need authoring permissions.
Hosting, upgrades and backups
Self-hosted open-source software has no proprietary license charge, but you still need a suitable environment, backup procedures, security maintenance and someone who can investigate failures. A managed service shifts some of those responsibilities to the vendor, though it does not remove the need to monitor data quality, credentials and reporting correctness.
Maintenance and support
Data sources and business definitions change. New departments request access, source columns get renamed and scheduled refreshes fail. Include the time needed to manage these changes and train users. A low-cost platform that needs repeated outside engineering help may not be inexpensive over a full year.
Simple annual ownership model
Estimated first-year total = initial setup and integration + 12 × (monthly-equivalent licensing + data/connector costs + hosting + internal support).
For annual subscriptions, convert the committed annual payment to a monthly equivalent for comparison, but keep the actual contractual commitment in the purchasing decision. Build low, expected and high cases when data volume, users or connector charges are uncertain, and avoid inserting assumed vendor charges as though they were verified prices.
Decision guide: which reporting setup should you choose?
Use this table to narrow your shortlist before running the common dataset test.
| If your reporting data is mostly in… | Evaluate | Check first |
|---|---|---|
| Google Sheets or Google-connected sources | Google Data Studio | Connector, credential and sharing requirements |
| Excel, Microsoft services or structured business data | Microsoft Power BI | Modeling effort, user licensing and refresh |
| Supported cloud business applications | Zoho Analytics | Connector scope, row limits and user plans |
| Relational SQL databases, with a preference for a managed or easier visual experience | Metabase | Plan-level data permissions |
| Relational SQL databases, with engineers able to operate a BI platform | Apache Superset | Hosting and maintenance costs |
| Any source, when you need broader visual and analytical exploration | Tableau Cloud | Budget and license role requirements |
For every shortlisted option:
- Test the real data connection.
- Reconcile the sample dashboard.
- Verify access controls.
- Measure actual setup effort.
- Estimate full-year ownership cost.
- Select the option that meets all mandatory requirements.
This flow identifies sensible candidates, not automatic winners. A tool can support the right category of data yet remain unsuitable because of a missing connector capability, restrictive permissions, expensive deployment or integration complexity. If your existing sources cannot support reliable reporting, solve the integration problem first rather than assuming a pricier visualization platform will fix it.
When is a spreadsheet enough instead of a BI platform?
A dedicated BI platform is not always necessary. A spreadsheet can be a reasonable first solution when data volume is manageable, calculations are stable, updates are infrequent and the audience is small. An operations manager producing a monthly expense summary from a consistently maintained spreadsheet may not need a separate BI environment.
A dedicated reporting tool becomes more attractive when:
- Several systems must feed the same report.
- Many users need controlled access to common metrics.
- Reports require recurring, reliable refreshes.
- Users need interactive filtering or exploration.
- Manual report preparation causes repeated errors or substantial rework.
- There is a continuing need for consistent, governed analytical models.
Even then, the first step may be improving the underlying dataset. Building a dashboard on inconsistent information does not make the information correct.
Common mistakes when selecting BI reporting tools
Choosing the cheapest license without checking integration cost
A free product can be costly if it needs custom data pipelines, paid connectors or continuous technical administration. Compare the complete working setup, including existing systems and the people who will maintain it.
Assuming a vendor demonstration represents actual setup time
A demo usually starts with prepared data and an authorized environment. A real business may need to reconcile field definitions, obtain API permissions or correct source records first. Use the shared sample test and record the full process rather than relying on promotional timing claims.
Confusing dashboard access with data security
Sharing a chart with a specific user does not prove that the user cannot reach restricted underlying information. Test the configured permissions, including data-source credentials, underlying models, exports and available query methods.
Buying advanced features before the requirements justify them
AI-assisted analysis, extensive semantic modeling and complex governance tools can be useful, but they may not help a small operations team that only needs a reliable daily dashboard. Begin with the smallest configuration that answers the required questions and meets the necessary controls.
Ignoring who owns the metrics
Even a correctly configured platform can show conflicting numbers when departments use different calculations. Assign ownership of important measures, document their definitions and validate results against agreed records. Microsoft’s Power BI guidance treats content ownership and governance as part of a successful BI rollout, and the principle applies whichever tool you choose.
Frequently asked questions about BI reporting tools
Which BI reporting tool is fastest to set up?
It depends on the source data, required calculations, permissions and available technical skills. For a clean Google Sheets reporting task, Data Studio may be a practical starting point. Metabase may be straightforward for a team with an accessible supported database. Power BI and Zoho Analytics can also support fairly direct workflows when their connectors and licensing match the requirements.
None of this establishes a universal setup-time ranking. Use the same dataset, acceptance tests and timing method to find out what is fastest in your environment.
Which BI tools require SQL knowledge?
Basic reports in Data Studio, Power BI, Zoho Analytics, Tableau and Metabase can often be built through graphical interfaces without writing SQL. More complicated transformations and analytical models may still need SQL or another calculation language. Apache Superset includes a no-code chart builder, but its deployment and SQL-oriented integrations generally suit teams with database and technical administration skills.
Are free BI reporting tools good enough for small businesses?
They can be, provided the available connections, permissions, reporting functions and operational responsibilities meet your needs. A free license is not zero implementation cost, so assess paid connectors, external data services, hosting, administrator time and potential plan upgrades.
What costs recur after the first dashboard is built?
Depending on the product and architecture, recurring costs may include report licenses, hosting, data warehouse queries, scheduled integration services, connector subscriptions, backups and technical support. Also account for employee time spent on metric changes, broken refreshes, permissions and new reporting requests.
Should small teams choose cloud BI or self-hosted reporting?
Cloud BI can simplify infrastructure responsibilities and offer an easier route to managed reporting. Self-hosted software can offer greater deployment control when you have the technical capacity. Neither approach automatically guarantees better security or lower cost, so evaluate required controls, system access, maintenance responsibilities and full operating expense.
The same trade-off appears when software vendors decide whether to build analytics themselves or buy a platform. Zoho’s analytics blog covers this in its post on build vs buy embedded analytics. That discussion is aimed at customer-facing analytics inside software products rather than internal team reporting, but the underlying question of owning the maintenance burden versus paying for a managed platform is similar.
Can BI reporting tools replace recurring spreadsheet reports?
Often, yes. Where data sources, metrics and access requirements are stable, automated reporting can reduce repeated manual collection and formatting. The tool still needs correct source data, supported refresh methods and defined ownership. For a more detailed discussion, see reporting automation benefits and practical examples.
Choose the reporting tool that solves your actual integration problem
For a small business, the best BI reporting setup is rarely decided by the longest feature list. It comes down to how reliably the platform connects to your existing information, how quickly your team can produce a verified dashboard, whether users get the right permissions and what the solution costs to operate.
Start with two or three plausible candidates. Give each the same dataset, metric definitions and acceptance criteria. Record first-dashboard effort, compare licensing against actual user roles and estimate the ongoing integration and support costs. Do not pay for advanced capabilities until a real requirement justifies them, and do not choose a free product without accounting for the engineering work needed to make it reliable.
If your data sits in several systems and you need a dependable reporting foundation, DataColab can help scope data integrations, reporting models and custom software development for business workflows. A useful first conversation starts with your existing data sources, the people who need access and the decisions the reports must support, not a predetermined software recommendation.
Pingback:Reporting Automation: Examples, Costs & ROI Framework
Pingback:Cloud BI Platforms Compared: Governance, Scaling and Hidden Costs