What is Time Series Forecasting? Simple Guide and Examples
Understanding what is time series forecasting can make a real difference if you want to make sense of data that changes over time. Time series forecasting is the process of predicting future values based on previously observed data points, where each point is associated with a specific time. This technique is widely used in our everyday world, from weather predictions to stock market analysis.
In this article, we will explain the core concept of time series forecasting in easy terms. We will cover essential steps, key differences from other prediction techniques, and share practical examples you might encounter in real life. By the end, you will know not just what time series forecasting is, but also how it works and why it matters in different industries.
What exactly is time series forecasting?
Time series forecasting is a specialized method for making predictions about the future by analyzing data points ordered in time. Each value is recorded at a specific time (like daily sales or hourly temperature). The main idea is to learn the underlying patterns—such as trends or cycles—and use this knowledge to forecast upcoming events.
This differs from other types of data prediction, which often ignore the order of data points. In static data prediction, all data records are treated as independent. However, time series data is dynamic because each point is related to past and possibly future points. For example, the temperature today is likely influenced by the temperature yesterday.
How does time series forecasting differ from machine learning forecasting?
It’s important to understand the difference between time series forecasting and generic machine learning forecasting. While both aim to predict outcomes, time series forecasting focuses specifically on data with a time component and sequence. Traditional machine learning models—like classic linear regression—assume data points are independent, but time series forecasting recognizes their ordered nature and temporal dependencies.
Techniques like ARIMA, Exponential Smoothing, Facebook Prophet, and Long Short-Term Memory (LSTM) networks have been designed to handle the patterns unique to time-series data, such as seasonality (regular, repeating changes), trends (long-term movement), and cycles. These models can capture, for example, weekly peaks in sales or yearly fluctuations in temperature. Meanwhile, generic models may not account for these effects, leading to less accurate results for time-dependent data.
What are some real-world applications of time series forecasting?
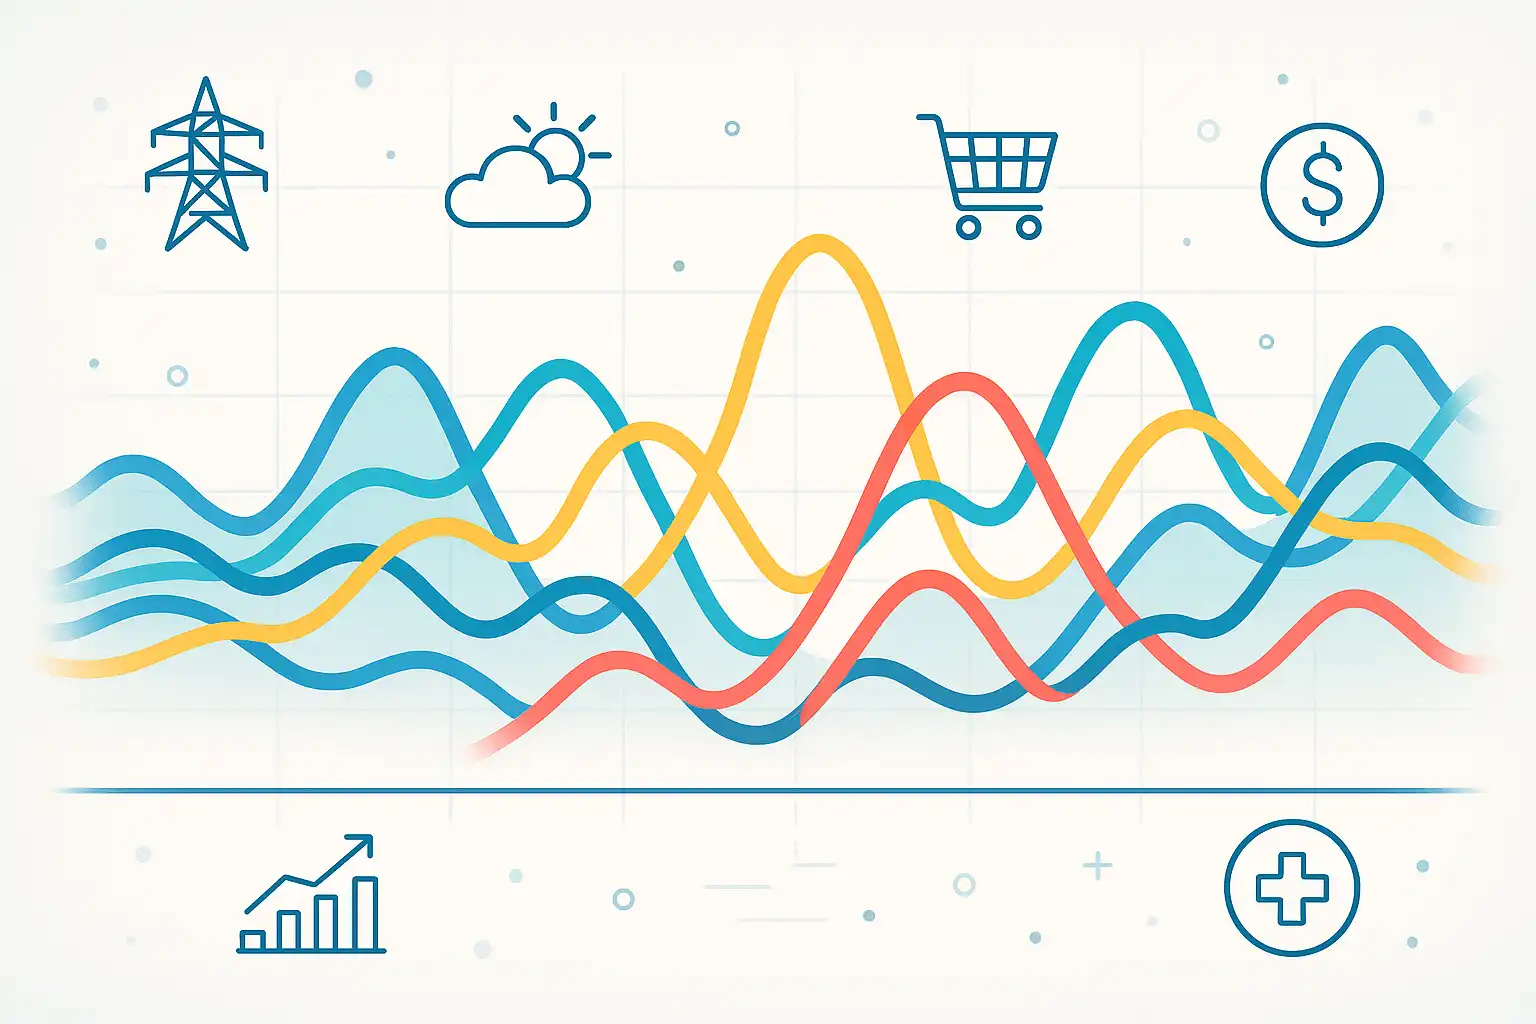
The uses of time series forecasting are broad and often essential for business decision-making. Here are some real-world examples:
- Economics and Finance: Forecasting stock prices, currency value, or economic indicators.
- Retail: Predicting sales, managing inventory, and planning promotions based on seasonal trends.
- Energy and Utilities: Estimating electricity demand to optimize power generation and reduce costs.
- Weather and Environment: Anticipating rainfall, temperature, or air quality levels for planning and resource management.
- Healthcare: Projecting patient visits, resource needs, or tracking disease outbreaks.
- Web and App Analytics: Monitoring visitor traffic, engagement, and server loads to prevent downtime.
- Supply Chain Management: Anticipating demand, optimizing logistics, and coordinating deliveries.
For example, in manufacturing, companies use time series forecasting to ensure that raw materials arrive just in time for production, reducing storage costs and improving efficiency. Similarly, utility companies rely on it to balance electricity supply and demand across different seasons.
What are the main steps in a simple guide to time series forecasting?
If you are new to time series forecasting, it’s useful to follow a clear, step-by-step process. Here’s a straightforward guide you can use:
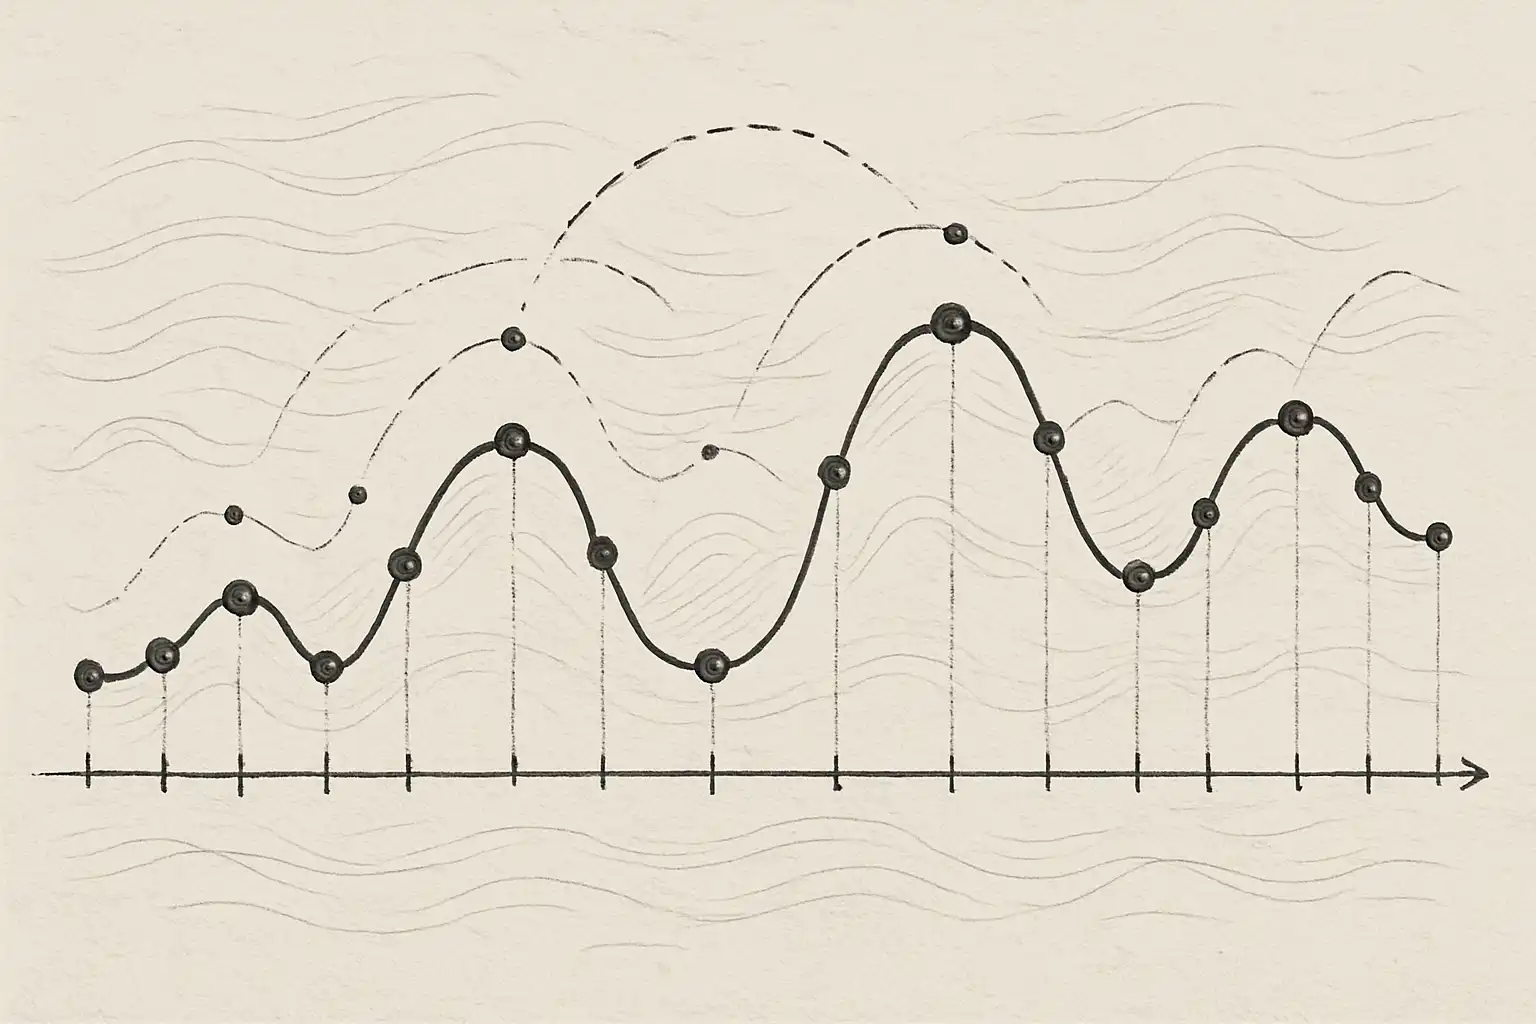
- Data exploration and visualization: Start by plotting your data. A simple line graph with time on the x-axis helps reveal patterns like trends and seasonality. Look for missing values or unusual points (anomalies).
- Data preprocessing: Clean your data by filling in missing values (using averages or interpolation), correcting errors, and ensuring regular time intervals. Removing outliers can improve your results.
- Feature engineering: Break down your data into components: trend, seasonality, and “noise.” You may add new features, such as lagged values (recent data points) or moving averages, to help your model learn relationships.
- Model selection and training: Choose a model suitable for your data. ARIMA works well for non-seasonal data with a clear trend, while Exponential Smoothing can handle seasonality. For complex, high-frequency data, machine learning approaches like LSTM or Prophet may be more effective.
- Validation and evaluation: Split your data into training and testing sets, always maintaining the chronological order. Use time-series-specific evaluation metrics like Root Mean Squared Error (RMSE) or Mean Absolute Percentage Error (MAPE) to check your model’s performance.
- Forecasting and deployment: Generate future predictions for your chosen time horizon. Continuously compare forecasts to actual results, and refine your model as you gather more data.
Throughout this process, following best practices—such as regular validation, careful feature selection, and understanding your business context—will improve accuracy and reliability.
Which tools and brands are popular for time series forecasting?
Many tools can help you perform time series forecasting efficiently. Widely-used options include:
- Microsoft Excel: Useful for basic forecasting and visualization tasks.
- Python libraries: pandas, statsmodels (for ARIMA), Prophet (developed by Facebook), and TensorFlow/Keras (for deep learning models like LSTM).
- R packages: forecast, tseries, and prophet.
- Cloud-based platforms: Google Cloud AI Platform, Azure Machine Learning, AWS Forecast.
As your project grows, moving from spreadsheet tools to programming languages allows for more flexibility and scalability. For those new to this area, there are step-by-step resources that guide you through the data science workflow guide and help build a solid foundation.
What are the benefits and challenges of time series forecasting?
Forecasting time-based data offers significant advantages, but it also comes with unique challenges. Let’s look at the pros and cons:
- Advantages:
- Supports better planning and decision-making by providing estimates of future events.
- Helps optimize inventory, staffing, and resource allocation in businesses.
- Can identify and anticipate trends, giving organizations a competitive edge.
- Detects seasonality, allowing for smooth adaptation to regular changes.
- Challenges:
- Requires clean, consistent, and high-quality data for accurate predictions.
- Complex models may be difficult to interpret and maintain without experience.
- Unexpected events (like sudden market shifts) can reduce forecasting accuracy.
- Choosing the right model and features takes expertise and domain knowledge.
For organizations wanting to align data initiatives with their broader aims, knowledge of data strategy alignment with business goals helps ensure that forecasting adds real value and fits your specific needs.
Best practices for effective time series forecasting
- Visualize your data early and often to spot patterns and outliers.
- Handle missing values with care—don’t just ignore them.
- Always keep the time order intact when splitting the dataset.
- Test multiple models; no single method works best in all cases.
- Regularly update your models as you get new data.
- Validate predictions against real outcomes and iterate as needed.
When these best practices are followed, companies can move toward more automated reporting for accurate and timely insights, improving both speed and reliability of decisions based on forecasts.

FAQ: Common Questions About Time Series Forecasting
- Can time series forecasting be used for any kind of data?
It’s best suited for data collected over consistent time intervals, like days, weeks, or months. Examples include sales numbers, temperature readings, and website visits. If data does not have a time component, other predictive methods may be better. - What is the difference between trend and seasonality?
A trend is the long-term movement in your data (like steady sales growth), while seasonality is a repeating pattern that happens at regular intervals (such as higher ice cream sales in summer). - How do you know which forecasting model to choose?
Your data’s characteristics help guide the choice. Simple, stable series might use ARIMA or Exponential Smoothing, while data with multiple seasonal effects or complex relationships may require advanced models like Prophet or LSTM. - How do you measure the accuracy of a forecast?
Common metrics include Root Mean Squared Error (RMSE), Mean Absolute Percentage Error (MAPE), and Mean Squared Error (MSE). Choosing the right metric depends on your goals and data type.