banner

BI analyst salary by state: where the highest-paying markets are

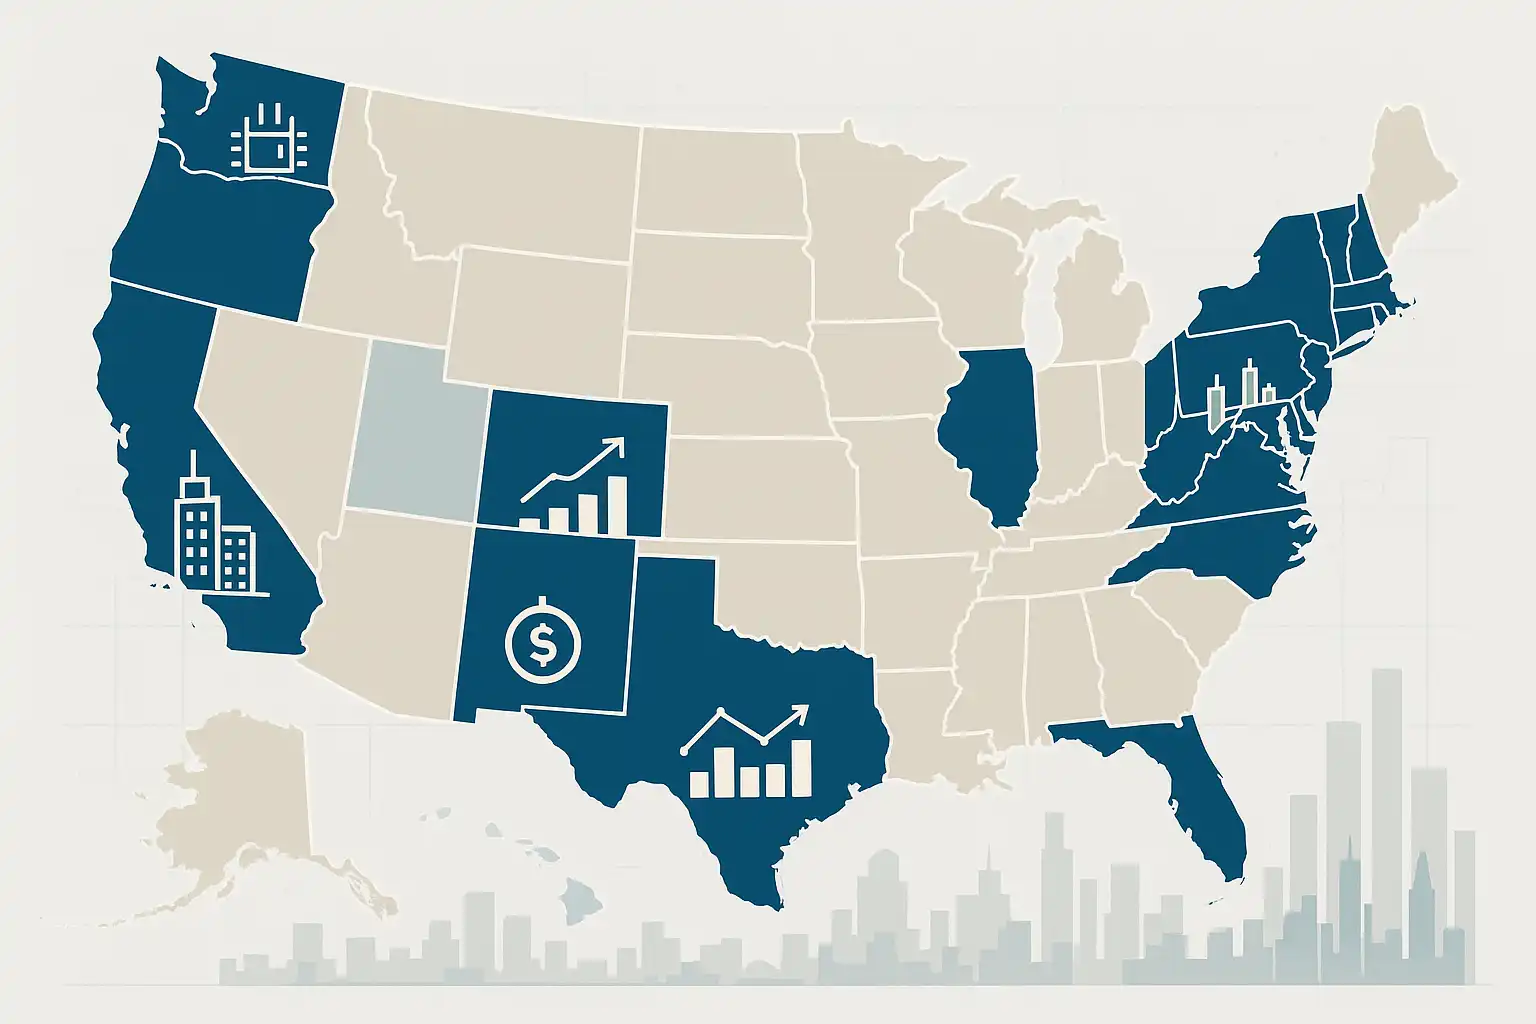
Business Intelligence (BI) analyst salaries vary significantly across U.S. states, influenced by cost of living, industry presence, experience, and company size. As of May 2024, the highest-paying states for BI analysts are California ($107,052), New York ($105,549), Washington ($104,098), New Jersey ($102,505), and Texas ($101,952). These states benefit from strong tech and finance sectors that drive demand and higher wages. While cost of living often dictates salary levels, states like Texas offer competitive pay with lower living expenses, enhancing purchasing power. Lower-paying states in the Midwest and South typically have smaller tech markets but offer a better cost of living balance. High-paying BI roles usually require advanced skills in tools like Power BI, Tableau, SQL, Python, and cloud platforms. Certifications and experience in data visualization and predictive analytics further boost earning potential. Remote BI positions may adjust pay based on the candidate’s location, while salary negotiations should consider total compensation and market trends. Ultimately, balancing salary with living costs and career growth opportunities is crucial for maximizing BI analyst compensation and quality of life across different states.

How much do BI analysts make per hour in contract roles?

Business Intelligence (BI) analysts in contract roles typically earn between $40 and $90 per hour, with rates rising above $100 for highly experienced professionals or specialized industries like finance and healthcare. Key factors influencing hourly pay include experience, education, certifications (e.g., Power BI, Tableau, AWS), and strong communication skills. Location also affects rates; urban centers like New York or San Francisco offer higher wages compared to smaller cities. Industry demand varies, with tech, finance, and healthcare generally paying more than retail or manufacturing. Skilled analysts proficient in SQL, Python, data modeling, and ETL processes command premium rates, especially when coupled with business insight and project management abilities. Contract roles offer flexibility and diverse project opportunities but lack traditional benefits, leading to higher hourly rates to offset costs like insurance and downtime. Setting competitive rates involves thorough market research, assessing personal skills and certifications, and factoring in business expenses. Remote work is increasingly common, allowing access to competitive pay regardless of location. New BI analysts can boost earnings by gaining experience, obtaining certifications, and building strong client relationships. Contracting provides freedom and income potential but requires self-discipline and strategic planning to manage workload variability and income gaps effectively.

Entry-level BI analyst salary expectations and negotiation tips

Entry-level business intelligence (BI) analysts in the U.S. typically earn between $63,676 and $90,273 annually, with variations influenced by education, location, industry, and skills. Bachelor’s degree holders average around $83,982, while advanced degrees can push salaries above $92,000. High-paying states include California and New Hampshire, whereas lower salaries are common in Hawaii and South Dakota. Proficiency in tools like SQL, Tableau, and Microsoft Power BI, along with relevant certifications, can significantly enhance earning potential. To maximize starting salary, candidates should build strong technical skills, earn industry certifications, highlight relevant experience, research company pay structures, and consider total compensation packages. Effective salary negotiation involves thorough market research, clear communication of skills, flexibility, and professionalism. Before accepting an offer, review the full compensation package, including benefits and growth opportunities. Entry-level BI analyst roles focus on data extraction, cleaning, reporting, and dashboard creation, with potential for advancement into strategic or specialized positions. Salaries tend to be higher in tech and finance sectors, and negotiation is common and encouraged to secure competitive pay.

Senior BI analyst compensation benchmarks and typical scope

Senior BI analyst salaries vary widely based on experience, education, location, industry, certifications, and responsibilities. In the U.S., typical base salaries range from $95,000 to $135,000 annually, reaching over $145,000 in major tech hubs like New York or San Francisco, with bonuses and stock options increasing total compensation by 10–20%. Industries like tech and finance offer higher pay compared to healthcare or manufacturing. Key salary influencers include over 8–10 years of experience, advanced degrees, proficiency in BI tools (Power BI, Tableau), and leadership roles managing teams or projects. Senior BI analysts translate complex data into actionable business insights, optimize data pipelines, create advanced dashboards, advise on data strategy, and mentor junior staff. Compared to related roles, they focus more on business value from data rather than infrastructure or predictive modeling. Benefits commonly include health coverage, retirement plans, remote work, and professional development budgets. To boost salaries, analysts should develop advanced technical skills, pursue leadership opportunities, network, and negotiate effectively. Continuous learning and strong communication skills are essential for career growth and maximizing compensation in this competitive field.

Business intelligence engineer pay: what affects compensation most

Business intelligence engineer salaries are influenced by several key factors, including experience, technical skills, education, industry, company size, and location. Entry-level BI engineers typically earn $70,000 to $90,000, mid-level professionals with 3-5 years of experience make $95,000 to $115,000, while senior engineers with 6+ years can earn $120,000 to $140,000 or more. Proficiency in tools like Power BI, Tableau, and programming languages such as SQL, Python, and R significantly boosts earning potential. Advanced degrees and certifications—such as Microsoft Certified: Data Analyst Associate, Tableau Specialist, and AWS Certified Data Analytics—further enhance salaries. Industry choice also matters, with finance, technology, and healthcare sectors offering higher pay than retail or education. Larger companies tend to offer structured salaries and benefits, whereas startups may provide equity and growth opportunities. Geographic location impacts compensation, but remote work is narrowing these gaps, enabling competitive pay regardless of location. To maximize salary, BI engineers should deepen technical expertise, pursue relevant certifications, network professionally, target high-value industries, and leverage remote work options. As demand for data-driven decision-making grows, the outlook for BI engineer salaries remains strong, rewarding those who continuously update their skills and adapt to evolving technologies.

Business intelligence analyst salary ranges by experience and industry

Business intelligence (BI) analyst salaries vary widely based on experience, industry, location, and skills. The average base salary is approximately $78,431 annually, with total compensation including bonuses and profit sharing ranging from $59,000 to $113,000. Entry-level analysts earn around $65,489, while experienced professionals with 10+ years can make $107,000 or more, especially in management roles. Industries like technology, insurance, and finance offer the highest pay due to their reliance on data-driven decisions. Key salary factors include location, education, technical skills (SQL, Power BI, Python), employer size, and job responsibilities. To maximize earnings, BI analysts should pursue advanced degrees, certifications, develop technical expertise, target high-paying sectors, build professional networks, and consider relocation. High-earning analysts excel in data analysis, visualization, database management, business operations understanding, and communication. Staying updated with new technologies and industry trends enhances career growth and compensation potential.

How to compare BI tool pricing without missing hidden costs?

This comprehensive guide on comparing BI tool pricing highlights the importance of evaluating total cost of ownership (TCO) beyond initial license fees. It outlines key steps including defining business needs, identifying all cost elements—such as licensing, infrastructure, training, and hidden fees—and comparing various pricing models like per-user, subscription, on-premises, and usage-based plans. The guide emphasizes uncovering hidden costs such as implementation, ongoing maintenance, integration, ETL tools, migration, and opportunity costs like downtime or lost productivity. It advises calculating TCO over several years, factoring in both hard costs and soft costs like staff labor and training. Cloud versus on-premises BI deployments come with distinct cost implications, where cloud offers scalability and lower upfront fees, while on-premises requires higher initial investment but may suit strict compliance needs. The guide stresses vendor transparency, recommending detailed inquiries about extra fees, support costs, and scalability options to avoid budget surprises. Practical tips include documenting all expenses, consulting real users, projecting long-term costs, and reviewing contracts carefully. Ultimately, a thorough, methodical pricing comparison aligned with organizational needs ensures selecting a BI tool that delivers the best value and supports sustainable growth.

Criteria that actually matter when evaluating BI software

When evaluating business intelligence (BI) software, focus on key criteria that ensure real value and long-term success. Prioritize ease of use with low-code/no-code interfaces to empower both technical and non-technical users. Real-time data access from cloud warehouses like Snowflake and AWS enables timely, accurate insights. Integration flexibility is crucial—your BI tool should seamlessly connect to diverse data sources, including structured and semi-structured formats, while supporting secure data handling through role-based permissions and compliance with standards such as GDPR and HIPAA. Data preparation and semantic modeling streamline workflows, reducing manual effort and ensuring consistent analysis. Interactive dashboards and collaboration features facilitate team-based decision-making and knowledge sharing. Scalability and future-proofing matter: choose cloud-native platforms that handle large data volumes, offer elastic scalability, and maintain up-to-date security compliance. Avoid common pitfalls like overemphasizing flashy features, neglecting ease of use, scalability, security, or collaboration. Leading BI platforms like Tableau, Power BI, and Looker excel in these areas, often incorporating AI-powered insights and natural language queries for enhanced analytics. For businesses aiming to maximize BI value, focusing on integration, real-time analytics, and collaborative capabilities drives actionable insights and competitive advantage across industries and sizes.

BI reporting tools for executive dashboards and board-ready metrics

BI reporting tools for executive dashboards are vital for delivering clear, real-time, and actionable insights that empower leadership teams to make informed decisions. These tools automate data integration from multiple sources, provide customizable visualizations, and ensure accurate, board-ready metrics by minimizing manual errors through validation and governance. Key features include interactive data visualization, real-time updates, predictive analytics, security controls, and flexibility tailored to various industries and leadership needs. While initial setup and integration may pose challenges, partnering with trusted BI providers can ease adoption and maximize benefits. BI dashboards transform decision-making by offering instant access to critical KPIs, enabling executives to quickly identify trends, risks, and opportunities, and pivot strategies efficiently. Popular BI solutions include self-service platforms like Tableau and Power BI, cloud-based tools, industry-specific options, and comprehensive enterprise suites. When selecting a BI tool, organizations should consider ease of use, compatibility, security, scalability, and vendor support. Ultimately, BI reporting tools enhance transparency, accelerate decision-making, and provide strategic oversight, making them indispensable for modern executive leadership.

Cloud BI platforms compared for scale, governance, and cost

This comprehensive comparison of cloud BI platforms highlights their advantages over traditional BI tools in scalability, governance, and cost-efficiency. Cloud BI connects directly to modern data warehouses like Snowflake, BigQuery, and AWS Redshift, enabling real-time insights without heavy IT infrastructure. These platforms effortlessly scale to handle massive data volumes and concurrent users through automatic resource allocation and parallel processing. Essential governance features include role-based access control, audit logs, semantic layers, data lineage, and encryption to ensure security and compliance. Pricing models favor flexibility with pay-as-you-go SaaS options ideal for small to medium businesses, while self-managed solutions offer customization for larger enterprises. Leading providers such as Microsoft Power BI, Tableau, Google Looker, and Amazon QuickSight offer unique strengths, with many incorporating AI and self-service analytics to empower users across departments. Cloud BI platforms also support collaborative, real-time reporting, fostering a data-driven culture and faster decision-making. When selecting a platform, organizations should assess use cases, data sources, governance needs, scalability, and total cost of ownership. Overall, cloud BI delivers agile, secure, and cost-effective business intelligence solutions that accelerate insights and support growth in dynamic environments.