
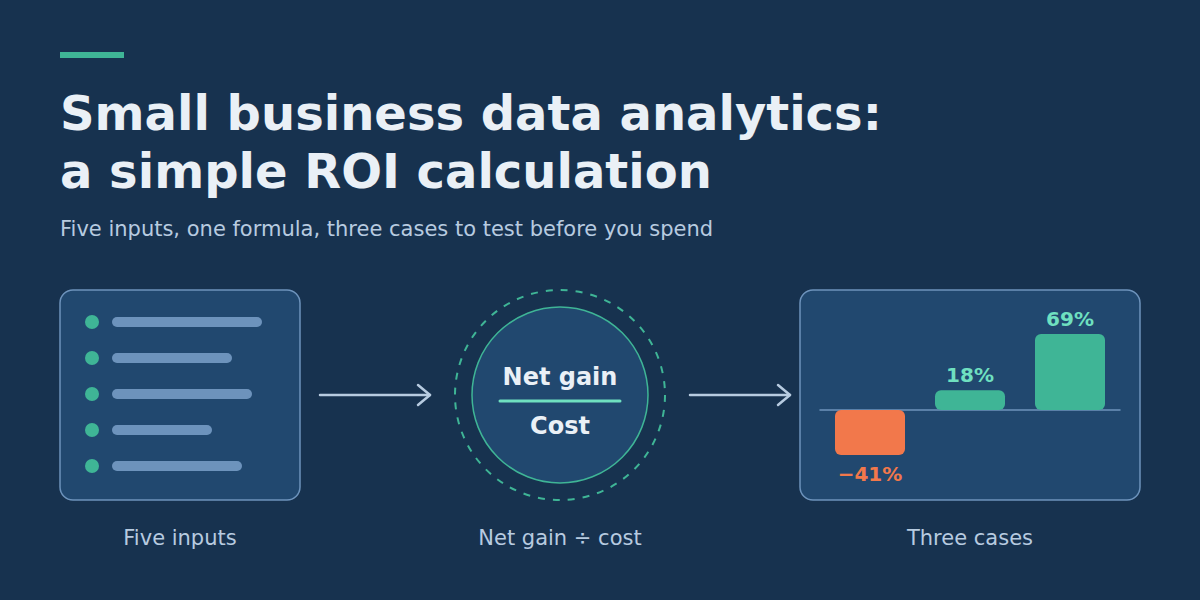
Small Business Data Analytics ROI: A Simple Calculation with 3 Use Cases
What matters most when estimating analytics ROI
- Analytics pays off through a specific change: a cost you stop paying, or a decision you make better. “Better insight” is not a payoff until you can name which decision changes.
- The calculation needs five inputs: setup cost, monthly running cost, hours saved, extra gross profit, and the share of the benefit you actually capture. Everything else is detail.
- Count uplift as gross profit, not revenue, and count saved hours only if they are redeployed or avoid a cost.
- Run a conservative, base and optimistic case. If the conservative case loses money badly, shrink the project or choose a different one.
If you run a small business and are weighing your first analytics investment, the practical question is not “is analytics worth it?” but “which one small project would pay for itself, and how would I know?” The short answer: pick one measurable decision or one repetitive task, record its current baseline, estimate the benefit with inputs you can defend, and divide the net gain by everything the project costs. This guide gives you that calculation, a copyable spreadsheet layout, and three worked small business data analytics examples. All three are hypothetical, and their figures are assumptions for illustration, not benchmarks or results from real companies.
Define the payoff before you calculate anything
Analytics creates financial value in only two ways. It either removes a cost (hours spent assembling reports, waste, rework) or improves a decision that earns or protects money (what to reorder, which customers to call, where to spend marketing budget). A dashboard that people look at but that changes no decision has no measurable return, however good it looks.
So start with a sentence in this shape: “If we had X information every Y, we would do Z differently, which would change metric M.” For example: “If we saw weekly stock cover for our top 80 products, we would reorder earlier, which would reduce stockout days.” If you cannot finish that sentence, the project is not ready to be costed.
Two common mistakes inflate small-business ROI estimates:
- Treating revenue as profit. An extra 1,000 in sales is worth only your gross margin on it. At a 40% margin that is 400.
- Treating every saved hour as cash. Ten hours saved is worth something only if the time moves to billable or revenue-generating work, or lets you avoid overtime or a hire. Otherwise the saving is real but not financial. The model below includes a “capture rate” for this reason.
Find your baseline first
ROI is a comparison between “before” and “after”, and most small businesses have no written “before”. Spend a week or two measuring it, because it is the number your whole estimate rests on:
- For a time-saving project: count how many people produce the report or task, how often, and how long it really takes. Ask them to log it for two cycles rather than guessing.
- For a decision project: measure the current outcome rate, such as stockout days per month, customers lost per month, or leads that never get a follow-up.
- For both: write down the loaded hourly cost (salary plus employer costs, divided by productive hours) and your gross margin on the revenue involved.
If the baseline is hard to measure, that is useful information. A project whose current state you cannot measure will also be hard to evaluate afterwards.
The calculation: one formula, five inputs
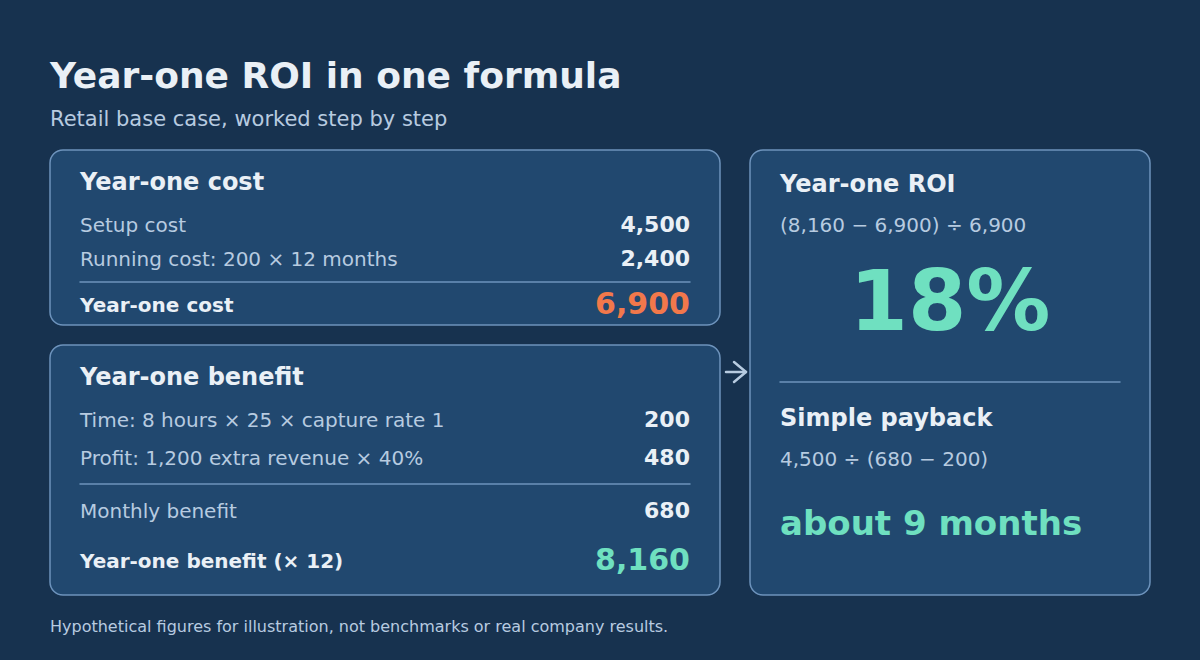
Use year one as the evaluation window, because it keeps setup cost visible. Define:
- Setup cost: one-off cost to get the first useful output: data preparation, building the model or dashboard, testing, and training.
- Monthly running cost: licences, hosting, maintenance, data-quality checks and the time someone spends reviewing the output.
- Monthly time benefit: hours saved × loaded hourly cost × capture rate.
- Monthly profit benefit: extra revenue recovered or retained × gross margin.
- Monthly benefit = time benefit + profit benefit.
Then:
- Year-one cost = setup cost + (monthly running cost × 12)
- Year-one benefit = monthly benefit × 12
- Year-one ROI = (year-one benefit − year-one cost) ÷ year-one cost
- Simple payback (months) = setup cost ÷ (monthly benefit − monthly running cost), valid only when that difference is positive
Here is the same logic as a spreadsheet you can copy into Excel or Google Sheets. Put the inputs in column B, rows 2 to 11:
A                         B
1  Input / output
2  Setup cost                        4500
3  Monthly running cost              200
4  Hours saved per month             8
5  Loaded cost per hour              25
6  Capture rate (0-1)                1
7  Extra revenue per month           1200
8  Gross margin (0-1)                0.4
9  Monthly benefit                   =B4*B5*B6 + B7*B8
10 Year-one cost                     =B2 + B3*12
11 Year-one ROI                      =(B9*12 - B10) / B10
12 Payback in months                 =IF(B9-B3>0, B2/(B9-B3), "no payback")
To run sensitivity cases, copy the sheet into three columns (conservative, base, optimistic) and change only the benefit inputs: hours saved, capture rate and extra revenue. Keep costs the same in all three, or raise them in the conservative case if you think the project could overrun. That is deliberate: costs are usually more certain than benefits, and the spread in benefits is what you need to see.
Three hypothetical use cases, fully worked
All amounts below are in a generic currency (use your own), and every input is an assumption chosen to show the method. Replace them with your measured baseline before drawing any conclusion for your business. If you want to see how automation shows up in other sectors, these automated services examples across industries are a useful companion to the three cases below.
1. Retail: a weekly reorder report to reduce stockouts
Illustrative example. An online shop sells about 80,000 a month from its top 80 products. By multiplying stockout days by average daily sales, the owner estimates that stockouts cost about 5% of that revenue, or 4,000 a month. A weekly report combining sales, stock on hand and supplier lead times is expected to help recover a share of it. A second benefit is that the owner stops rebuilding the stock spreadsheet by hand. Gross margin is 40%, and the owner’s time is valued at 25 an hour. Setup is 4,500; running cost is 200 a month.
| Input / result | Conservative | Base | Optimistic |
|---|---|---|---|
| Share of stockout loss recovered | 15% | 30% | 45% |
| Revenue recovered per month | 600 | 1,200 | 1,800 |
| Gross profit from it (40%) | 240 | 480 | 720 |
| Hours saved per month | 4 | 8 | 10 |
| Time benefit (25 per hour, fully captured) | 100 | 200 | 250 |
| Monthly benefit | 340 | 680 | 970 |
| Year-one benefit | 4,080 | 8,160 | 11,640 |
| Year-one cost (4,500 + 200 × 12) | 6,900 | 6,900 | 6,900 |
| Year-one ROI | −41% | 18% | 69% |
| Simple payback | about 32 months | about 9 months | about 6 months |
How to read it: the base case is modestly positive, but the conservative case does not pay back within three years. The project depends on whether the report really changes ordering behaviour. A cheaper first step, such as a stock-cover sheet for only the 20 fastest sellers, would lower the setup cost and make the downside less painful.
2. Agency: automating monthly client reports
Illustrative example. A small marketing agency produces reports for 15 clients, each taking about 3 hours of manual copying, charting and checking: 45 hours a month. Automating data collection and the standard charts might cut that by 50% to 80%. (For a closer look at what this kind of change involves, see these reporting automation benefits and examples.) The agency values staff time at 40 an hour, but saved hours only count if they are redeployed to billable work or reduce contractor spend, so the capture rate is set well below 100%. No revenue uplift is claimed here. Setup is 4,000; running cost is 150 a month.
| Input / result | Conservative | Base | Optimistic |
|---|---|---|---|
| Reporting time removed | 50% | 70% | 80% |
| Hours saved per month (of 45) | 22.5 | 31.5 | 36 |
| Capture rate (redeployed or avoided cost) | 25% | 50% | 75% |
| Monthly benefit (hours × 40 × capture) | 225 | 630 | 1,080 |
| Year-one benefit | 2,700 | 7,560 | 12,960 |
| Year-one cost (4,000 + 150 × 12) | 5,800 | 5,800 | 5,800 |
| Year-one ROI | −53% | 30% | 123% |
| Simple payback | about 53 months | about 8 months | about 4 months |
How to read it: this is a pure time-saving case, so the capture rate drives the result. If the agency is already at capacity, the freed hours can be sold or can prevent a hire. If it is short of work, the saving is mostly cosmetic. The report quality benefit (fewer copy-paste errors, faster delivery) may be real but is deliberately left out of the number.
3. SaaS: flagging customers likely to cancel
Illustrative example. A small subscription software company loses about 12,000 a month in billings to cancellations. It plans to combine product usage and billing data into a simple at-risk list so that customer success can contact accounts whose activity has dropped. Gross margin on software revenue is 80%. A further 4 hours a month of manual spreadsheet work is removed, valued at 30 an hour. Setup is 8,000 because usage data must be pulled from the product; running cost is 300 a month. For simplicity, the “revenue retained” figure below is the billings kept per month on average over the year.
| Input / result | Conservative | Base | Optimistic |
|---|---|---|---|
| Share of churn prevented | 5% | 10% | 15% |
| Revenue retained per month | 600 | 1,200 | 1,800 |
| Gross profit from it (80%) | 480 | 960 | 1,440 |
| Time benefit (4 hours × 30) | 120 | 120 | 120 |
| Monthly benefit | 600 | 1,080 | 1,560 |
| Year-one benefit | 7,200 | 12,960 | 18,720 |
| Year-one cost (8,000 + 300 × 12) | 11,600 | 11,600 | 11,600 |
| Year-one ROI | −38% | 12% | 61% |
| Simple payback | about 27 months | about 10 months | about 6 months |
How to read it: retained subscribers keep paying after year one, so a longer window would look better than this simplified year-one view. The opposite risk is attribution. Some flagged customers would have stayed anyway, so a fair test compares contacted accounts with a similar group that was not contacted.
What these three examples show
With these assumptions, none of the three projects is a guaranteed win, and none is hopeless. Each base case pays back within about a year, yet each conservative case does not. That is the realistic shape of a first analytics project. The useful decision rule is to proceed when the base case pays back in under 12 months and the conservative case does not turn into a large, unrecoverable loss. If it does, narrow the scope until the setup cost falls, or choose a project with a more certain baseline.
Do you have the data you need?
Most first projects fail on data access, not on analysis. Before you commit, check each item for the use case you picked:
-
- Can you export it? Your accounting, e-commerce, CRM, ad platform or product database needs a usable export, report or API connection.
- Is it consistent? Product names, customer IDs and date formats should match across systems, or you will pay to clean them.
- Is there enough history? Trend and forecasting work usually needs months of data. A simple report can start with far less.
- Is the metric defined? Agree in writing what counts as a “stockout day”, an “active customer” or a “churned account”. Without that, every report invites an argument.
- Who owns it? Someone must check refreshes, fix broken connections and answer “why does this number look odd?”.
If most answers are “no”, your first project may be tidying and connecting the data, with an ROI case based on faster, more trustworthy reporting rather than any dramatic uplift.
Costs small businesses often overlook
- Your own time. Supplying data, explaining how the business works and reviewing outputs often takes more of your hours than the invoice suggests.
- Licences per viewer. Some BI tools charge by user or capacity. Microsoft’s Power BI guidance documentation includes an implementation planning series that treats subscriptions, licenses and trials as one of its subject areas, alongside topics such as BI strategy, tenant setup and security. That series also suggests working through the key decisions and actions listed for each topic as a starting point for your plan. Check current terms for any tool you consider rather than relying on a headline price.
- Data cleaning. Messy source data can be the largest part of setup.
- Maintenance. Source systems change fields, APIs change and definitions drift. Budget for that in the monthly running cost instead of treating the build as finished.
- Training and adoption. A report nobody uses delivers none of the modelled benefit.
- Checking predictive models. If your project goes beyond reports and uses a forecast or a churn-risk model, budget time to test and review it. The NIST AI Risk Management Framework is a voluntary framework, released in January 2023, intended to help organisations build trustworthiness considerations into the design, development, use and evaluation of AI products, services and systems. NIST notes that version 1.0 is being revised, so check the current version before relying on it.
Choosing your first use case: a quick scoring check
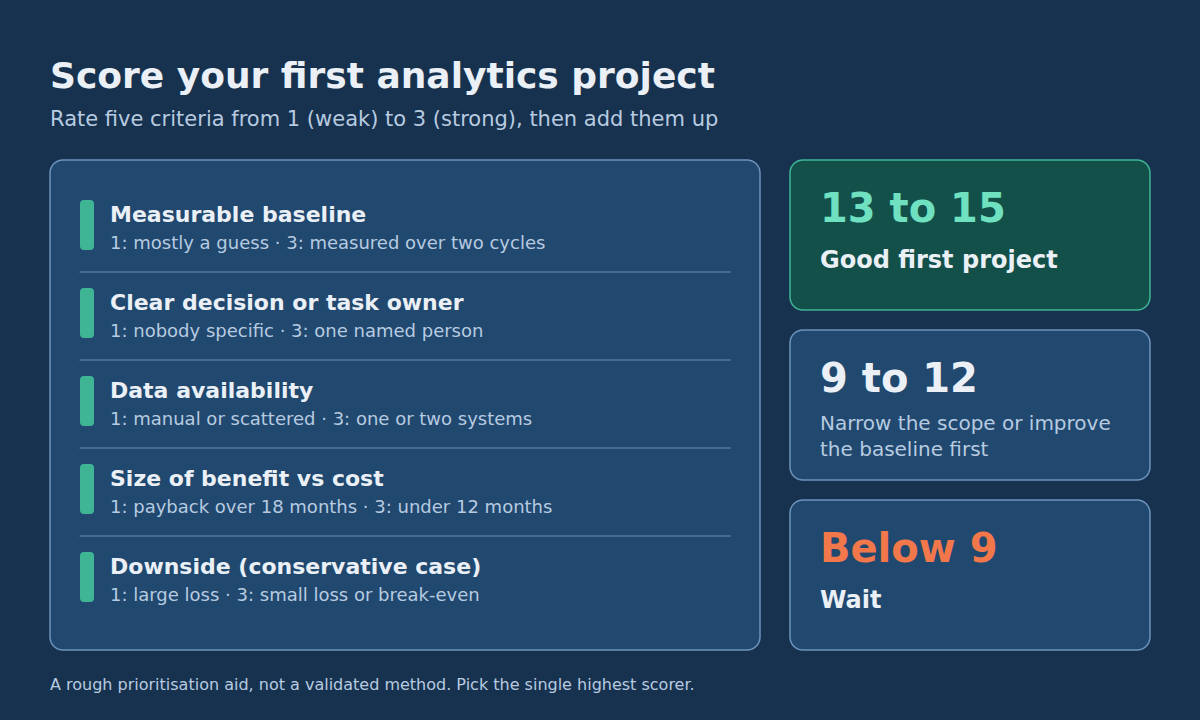
If you have several ideas, score each from 1 (weak) to 3 (strong) on the criteria below. This is a rough prioritisation aid, not a validated method, so adjust it to your business.
| Criterion | 1 point | 3 points |
|---|---|---|
| Measurable baseline | Mostly a guess | Measured over at least two cycles |
| Clear decision or task owner | Nobody specific | One named person acts on the output |
| Data availability | Manual, scattered or missing | Exportable from one or two systems |
| Size of benefit vs cost (base case) | Payback over 18 months | Payback under 12 months |
| Downside (conservative case) | Large loss | Small loss or about break-even |
A total of 13 to 15 suggests a good first project; 9 to 12 suggests narrowing the scope or improving the baseline first; below 9 suggests waiting. Pick the single highest scorer, not the most ambitious idea.
Where to go from here
Take one use case through the spreadsheet above this week. Measure the baseline, fill in the three cases, and note which input you trust least. That input is where to test first, perhaps with a manual pilot before any software is built. After the project runs, compare real figures against your base case and update the model, because your second project will be easier to justify with measured numbers than with assumptions.
If you would like help with the build, DataColab can scope a small pilot around one measurable decision, with the costs and success measure agreed up front. If the pilot proves the case and the process needs more than a report, custom software development for business workflows is the natural next step to discuss. You are welcome to get in touch to talk through your use case and what data you already have.