
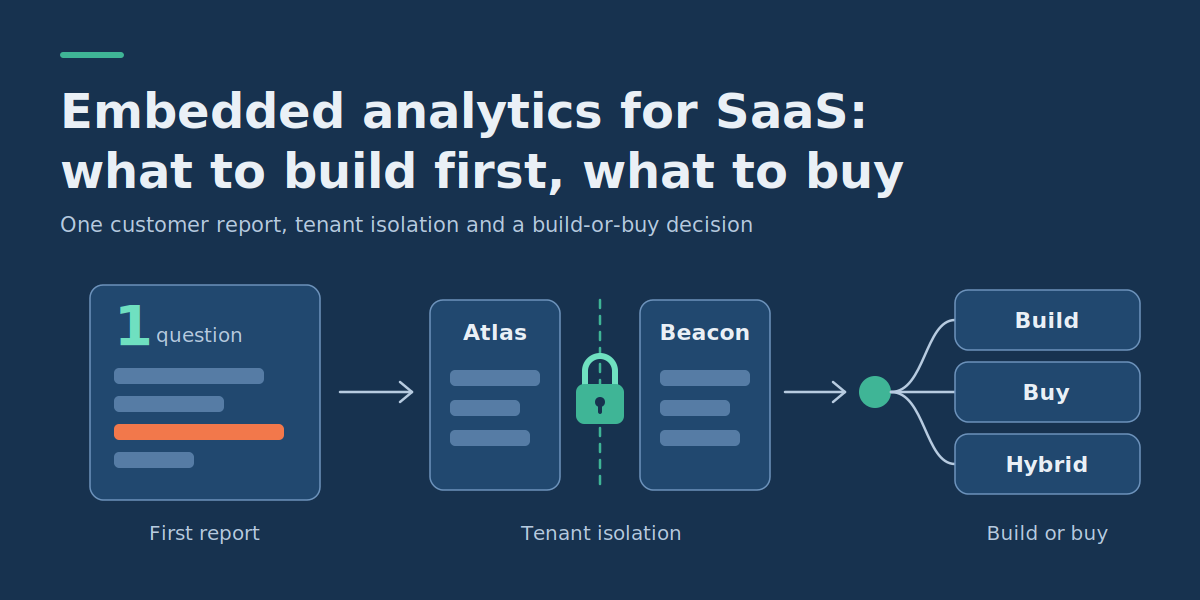
Embedded Analytics for SaaS: What to Build First and What to Buy
Quick answer: Start with one customer-facing report that supports a real decision, enforce tenant isolation before launch, and only then decide whether to build, buy or combine both. Embedded analytics for SaaS lets customers view reports and act on data without leaving your application, but a few charts are not a reliable reporting product.
Key Takeaways
- Start with a customer decision, not a dashboard. Your first report should answer a question customers repeatedly need to resolve.
- Enforce tenant isolation before launch. Authentication alone does not stop one customer from reaching another customer’s reporting data.
- Build when the scope is narrow. Consider an embedded BI platform when customers need flexible exploration, custom reports and advanced analytics.
- Compare ownership costs. Engineering maintenance, support, data processing and licensing can matter more than the first chart implementation.
- Test the whole experience. Dashboards, API requests, exports, permissions and performance must work together.
SaaS teams must decide which insights customers actually need, how data access will be controlled and whether analytics capabilities should be developed internally or purchased. The most practical starting point is usually one valuable report, backed by trustworthy metrics and tested access controls. Once that works, you can judge whether more flexible analytics justify a dedicated platform.
What Types of Embedded Analytics Can a SaaS Product Offer?
Embedded analytics ranges from a simple operational report to a fully interactive business intelligence environment. Each approach solves a different problem and needs a different level of engineering investment.
1. Operational Reporting
Operational reporting answers specific questions about activity inside the application. A support product might show unresolved tickets, average response times or overdue conversations. An inventory platform might report stock movements and pending orders.
These reports use predefined metrics, limited filters and links back to the underlying records. They suit customers who need to monitor their work rather than run open-ended analysis.
Best fit: products with a few repeatable reporting requirements and a well-defined data model.
2. Interactive Dashboards
Interactive dashboards let users explore data through filters, date ranges, drill-downs and comparisons. A support manager might compare response times across teams, investigate a rise in unresolved requests and open the affected records.
This takes more than chart rendering. Filters must give consistent results across components, queries must stay efficient and permissions must still apply when users drill into detail.
Best fit: products where customers need several related views but do not need to design reports themselves.
3. Self-Service Embedded BI
Self-service business intelligence (BI) lets authorized users build their own reports, choose dimensions and measures, explore datasets and share findings.
That flexibility adds responsibilities: metric definitions, permission management, query limits, report ownership and customer support. Unrestricted query builders without these controls create both security and usability problems. For a closer look at balancing freedom with control, see our comparison of self-service BI tools for governed analytics.
Best fit: products serving customers with varied reporting needs, dedicated analysts or heavy customization requirements.
Start With the First Customer Question Your Reporting Must Answer
The first decision is not which chart library or vendor to use. It is identifying a question customers often ask that your product cannot yet answer efficiently.
Consider an illustrative SaaS application used by support teams. Its customers repeatedly ask: “Which support teams are missing their first-response targets, and which tickets need attention?”
Instead of a generic analytics homepage full of charts, the team can build one reporting experience around that question.
A Worked Example: Defining the First Embedded Report
Assume a hypothetical application with multiple customer organizations, each with its own teams and tickets. The product already records ticket creation times, first-response times, team assignments and response-time targets.
| Requirement | First-release decision | Acceptance criteria |
|---|---|---|
| Customer question | Which teams are missing first-response targets? | A manager can identify teams with overdue responses and open their affected tickets. |
| Primary metric | Percentage of eligible tickets whose first response breached the target. | Calculation matches an agreed definition using known test records. |
| Time range | Previous seven complete calendar days, in the customer’s configured time zone. | The selected period and time zone are clearly displayed. |
| Filters | Permitted support team and reporting period. | Filters never expand access beyond the user’s permissions. |
| Visualization | Summary metric, team comparison and ticket detail table. | Users understand the result without learning a separate BI interface. |
| Next action | Open a filtered list of tickets requiring attention. | Every linked ticket remains subject to normal application authorization. |
| Data freshness | Refresh at an agreed interval, such as every 15 minutes. | The app shows the actual latest refresh time and handles delayed updates. |
The 15-minute interval is an illustrative requirement, not a universal recommendation. A financial reconciliation product may tolerate a daily update, while an operational monitoring product may need far fresher data.
The metric also needs explicit business rules. The team must decide whether deleted tickets, reopened tickets, tickets without a first response and tickets created outside business hours are included, then document the calculation and check it against representative records before customers rely on it.
That is the difference between implementing a chart and designing a reporting feature: the useful product is the complete path from a trustworthy metric to an informed action.
Embedded Analytics MVP Checklist: What Should You Build First?
Use this checklist as a release gate rather than treating every analytics capability as equally important.
Must-Have Requirements
- One validated use case: the report answers a specific question confirmed by target customers or existing support requests.
- Documented metric definitions: calculations, reporting periods, exclusions and time zones are unambiguous.
- Tenant and role-based authorization: every user sees only the data permitted by their organization and role.
- A small set of useful filters: customers can select relevant time periods and organizational dimensions without exposing unauthorized data.
- Clear data freshness: users can tell recent data from delayed or incomplete data.
- Actionable navigation: users can move from a summary to the underlying authorized records.
- Controlled query performance: reporting requests have resource limits and do not overwhelm critical application workloads.
- Operational ownership: someone investigates incorrect totals, failed refreshes, slow queries and customer-reported problems.
Features to Defer Until Demand Is Established
- Drag-and-drop report builders and unrestricted custom dimensions
- Large visualization libraries with rarely used chart types
- Predictive analytics and AI-generated explanations
- Complex report scheduling, distribution and collaboration
- Customer-specific dashboard designers and extensive white-label configuration
These are not universally unnecessary. Scheduled CSV exports may be essential for a finance-oriented SaaS product yet irrelevant to the first version of an operational dashboard. A useful MVP is not the version with the fewest features; it is the smallest version that safely completes the customer’s reporting task.
How Do You Enforce Tenant Isolation in Embedded Analytics?
Tenant isolation means one customer organization’s users cannot access another organization’s data or reporting resources unless the application explicitly allows it. In multi-tenant SaaS this applies even when customers share databases, analytics infrastructure or dashboard definitions.
A successful login is not enough. The reporting system must enforce which tenant, team, records and operations the authenticated user may access.
Separate Authentication, Authorization and Presentation
- Authentication establishes who is requesting the report.
- Authorization determines which organizations, datasets, records and actions that user may access.
- Data isolation enforces those restrictions across queries, storage, embedded reports and related resources.
- Presentation displays authorized information through charts, tables and filters.
A dashboard that shows one tenant because a browser filter is selected is not evidence of isolation. A user may modify the request, call an API directly or open another report identifier. This is the pattern behind broken object-level authorization, where an API fails to verify that the caller may access the requested resource.
Choose How Tenant Data Will Be Separated
- Shared tables with tenant-aware access policies: organizations share tables containing tenant identifiers, and queries and database policies enforce the scope.
- Separate schemas, databases or analytics workspaces: customers get distinct environments, which can simplify some isolation boundaries but adds provisioning and operational work.
- A hybrid model: some infrastructure is shared while selected customers or sensitive workloads use more isolated resources.
In PostgreSQL, row-level security policies can restrict which rows database roles may read or modify. Configuration matters: table owners and roles with bypass privileges may not be subject to ordinary policies, and reporting connections must not bypass the intended restrictions.
Buying a BI platform does not remove this design work. Microsoft’s Power BI guidance library includes a dedicated article on row-level security, alongside guidance on implementation planning and security, which shows that isolation is something you design and configure, not something a platform grants automatically.
Practical Tenant-Isolation Test Cases
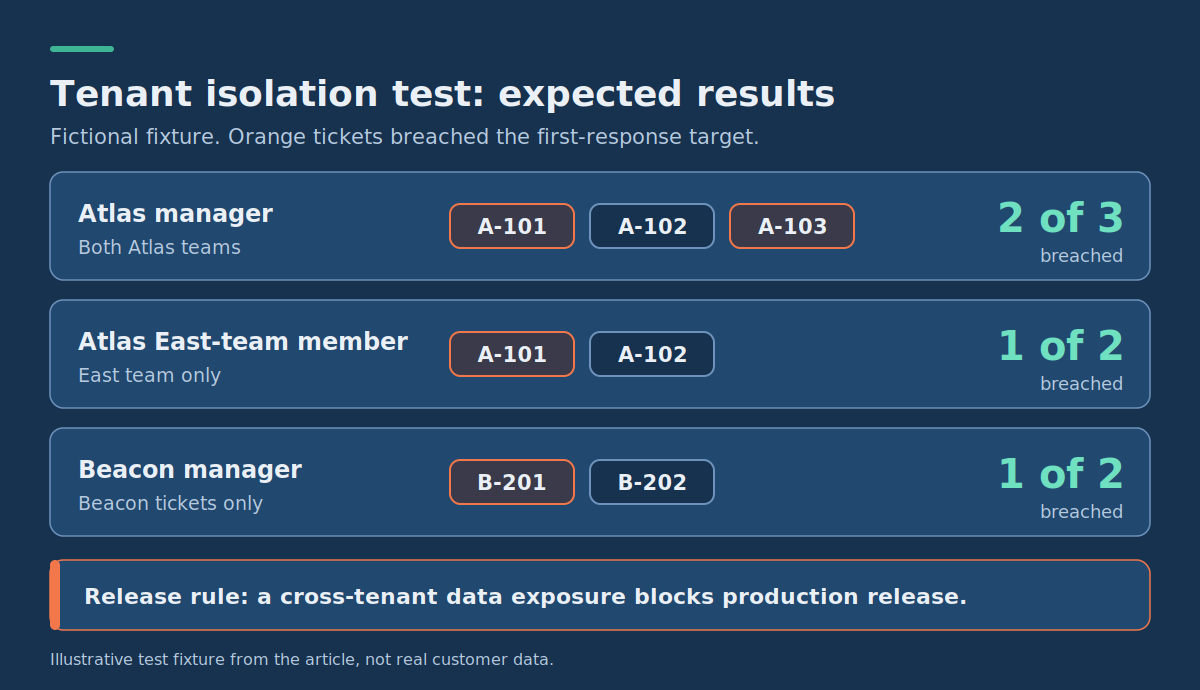
Here is a reproducible exercise for the hypothetical support application. Prepare two fictional organizations:
- Atlas (Tenant A): tickets A-101, A-102 and A-103. A-101 and A-103 breached their targets. A-101 and A-102 belong to the East team; A-103 belongs to the West team.
- Beacon (Tenant B): tickets B-201 and B-202. Only B-201 breached its target.
Create three test identities: an Atlas organization manager with access to both teams, an Atlas East-team member with access only to that team, and a Beacon organization manager.
Expected breach counts: two of three tickets for Atlas overall, one of two for Atlas East, and one of two for Beacon. The same authorized scope must apply to the summary and the underlying tickets.
| Test | Action | Expected result |
|---|---|---|
| Organization separation | Open the report as the Atlas manager. | Only Atlas records appear; the breached count is two. |
| Team restrictions | Open the report as the Atlas East-team member. | Only A-101 and A-102 are accessible; the breached count is one. |
| Cross-tenant URL access | As an Atlas user, request a Beacon report or ticket identifier directly. | Access is denied without disclosing Beacon content. |
| Manipulated filters | Change a request parameter to Tenant B or an unauthorized team. | The request is rejected or constrained to the user’s scope. |
| Direct API access | Call the reporting endpoint without using the dashboard. | The API applies the same policy as the interface. |
| Export permissions | Export the report as each identity, if exports are enabled. | Records and totals match the user’s authorized scope. |
| Cache isolation | Request the same report as Atlas and Beacon, including after a result is cached. | Neither customer receives the other’s cached data. |
| Expired access | Repeat a request after the session or token is invalidated. | Protected data is not returned without valid authorization. |
| Empty tenant | Open reporting for a third organization with no tickets. | The report shows zero or an empty state, not another tenant’s data. |
Run these checks against the real reporting integration, not mocked chart components. If you later add scheduled emails, shareable reports or background exports, extend the same tests to them.
Release rule: a known cross-tenant data exposure or authorization bypass should block production release, however good the dashboard looks.
Embedded Analytics Build vs Buy: A Practical Decision Matrix
The build-versus-buy question is not whether developers can create attractive dashboards. It is whether your organization wants to own the broader reporting capabilities and their continued maintenance. Three approaches are worth comparing:
- Build: develop reporting queries, APIs, authorization and user-facing features on your existing stack.
- Buy: integrate a dedicated embedded analytics platform with a larger set of reporting and administration features.
- Hybrid: keep business-specific data models and workflows while using a purchased analytics engine or reusable visualization components.
| Decision factor | Build internally | Buy an embedded platform | Hybrid approach |
|---|---|---|---|
| Reporting scope | A few stable, predefined reports. | Extensive reporting and customer-defined exploration. | Standard analytics alongside custom product workflows. |
| Product customization | Full control over behavior and interface. | Depends on platform capabilities and licensing. | Control business-specific interactions while reusing analytics features. |
| Security ownership | Your team implements and maintains authorization. | Vendor provides controls that you must configure and integrate correctly. | Responsibilities are split across app and platform. |
| Development effort | Small for limited reporting, substantial for advanced BI. | Integration, data modeling, identity and tenant configuration remain. | Less generic BI work, but integration remains. |
| Maintenance | Your team owns queries, rendering, upgrades and issues. | Vendor maintains the platform; you support app-specific issues. | Internal and external dependencies both need support. |
| Commercial exposure | Engineering, infrastructure and support costs. | Licensing, capacity, integration and support costs. | Platform charges plus internal ownership. |
| Long-term constraints | Internal capacity and architecture. | Vendor APIs, deployment choices, licensing and roadmap. | Integration complexity at system boundaries. |
When Should You Build Embedded Reporting Yourself?
Building a focused reporting feature makes sense when the data already lives in your application database, the experience is specific and the number of report types is limited. The support-reporting MVP above might need only a few predefined queries, an authenticated reporting API and a small set of interface components. A full BI platform could add more integration and administration work than that feature warrants.
Building a narrow report is not the same as building a BI platform, though. A growing backlog of custom exports, configurable dashboards, complicated permissions and customer-specific reports suggests the feature is outgrowing its scope. If the reporting needs to fit tightly into your product’s processes, custom software development for business workflows is often the right route for the parts only you can define.
When Does Buying Make More Sense?
Buying becomes attractive when the application must support many report types, interactive exploration, different customer data sources, sophisticated report administration or user-created analytics.
But buying does not remove the need to define metrics, integrate identity, enforce tenant permissions and test the result. A platform with polished dashboards that cannot support your tenant model is not an acceptable choice, and one with every possible feature may be needlessly expensive for customers who only need operational reporting.
What Does Zoho’s Build-vs-Buy Analysis Say?
Zoho, which sells an embedded analytics product, has published a detailed build vs buy embedded analytics guide. Its main points are useful for framing the decision, provided you remember the author has a commercial interest in buying:
- Its conclusion: Zoho argues that for most SaaS companies, buying is strategically smarter than building in-house.
- Its time estimates: it says building to an enterprise standard takes 12 to 18 months, versus 6 to 10 weeks to integrate a purchased platform. These are Zoho’s own figures, not independent benchmarks.
- Its maintenance claim: it reports that teams spend 20 to 30 percent of ongoing development time maintaining an analytics stack after launch.
- Its hidden costs: it highlights engineering opportunity cost, specialist hiring, scaling problems as customer numbers grow and the risk that a single multi-tenant misconfiguration exposes one customer’s data to another.
- When it says building still makes sense: analytics is the core product, the data architecture is unusual, a dedicated data team already exists, or strict compliance rules rule out external platforms.
Treat these as considerations to test against your own numbers, not as proof that one approach always wins. Your own estimates, measured usage and tenant requirements should drive the final call.
Which Embedded Analytics Options Should SaaS Teams Evaluate?
There is no universally best embedded analytics provider. A sensible shortlist reflects your data architecture, customer requirements, access-control model and pricing constraints.
Microsoft Power BI is a common starting point for teams already in the Microsoft ecosystem. Its guidance library offers best-practice material from the team that builds Power BI, including articles on star schema data modeling, DirectQuery and composite models, and monitoring report performance. These help you judge how much modeling and tuning work a Power BI-based approach would involve.
For a broader comparison of tools built for speed, see our guide to the best BI tools for fast reporting.
Whichever options you shortlist, require each to implement the same customer report and pass the same tenant-isolation tests during a proof of concept. Compare real integration behavior, not feature checkboxes.
How Much Does Embedded Analytics Cost for a SaaS Product?
Pricing varies by deployment and licensing model. Vendors may charge by users, usage, allocated capacity, contract terms or an OEM arrangement that lets you distribute analytics inside your own product. Zoho’s guide describes four common models: per-user or per-viewer, usage-based, revenue-share or OEM, and infrastructure-based. It also notes that per-active-user pricing can look cheapest at small scale but climbs with adoption.
Before requesting quotes, establish how customers will actually use the feature.
A Worked Usage Estimate
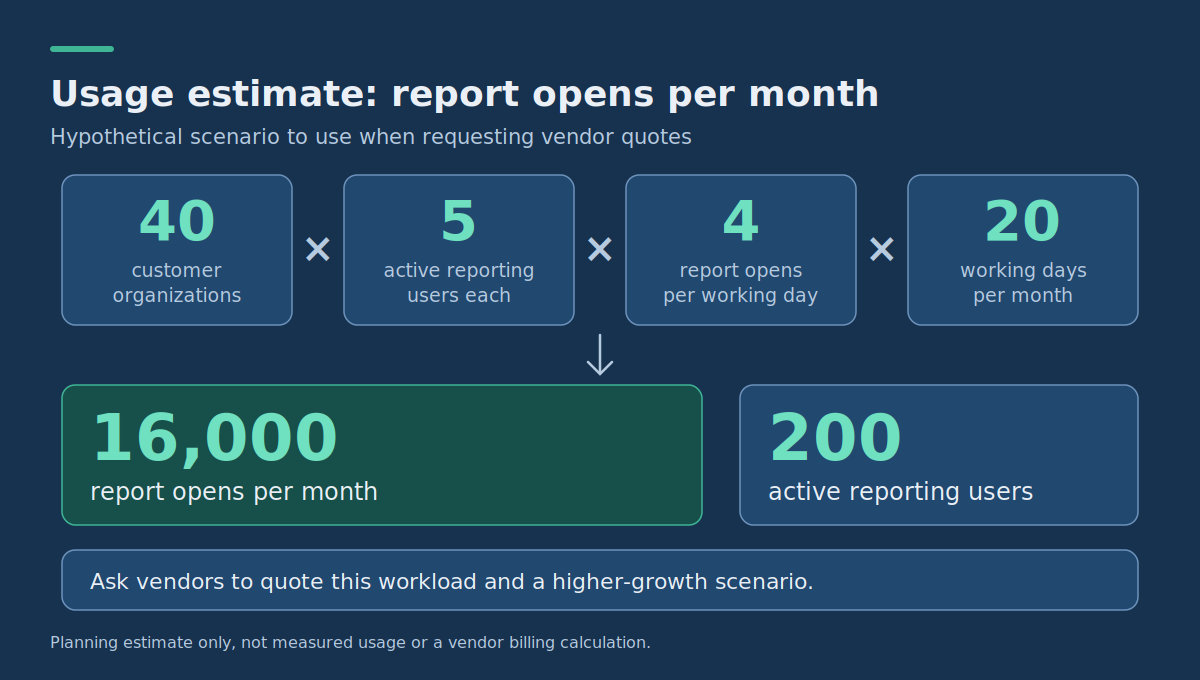
Assume this hypothetical scenario:
- 40 customer organizations use the reporting feature.
- Each has five active reporting users.
- Each user opens four reports per working day.
- The workload runs across 20 working days per month.
40 organizations × 5 users × 4 report opens × 20 days = 16,000 report opens per month, across 200 active users. This is a planning estimate, not measured usage or a vendor billing calculation.
Request quotes against this workload and a higher-growth scenario, and clarify whether the vendor bills per view, query, session or active user, since these units are not interchangeable. Also provide expected peak concurrency, dataset size, refresh requirements and export volume. 16,000 opens spread evenly across a month place very different demands on infrastructure than the same volume in heavy bursts.
Compare Total Ownership Cost, Not Just the License
Use this first-year model:
- Build cost = initial development + 12 × (monthly infrastructure + monthly engineering maintenance and support)
- Buy cost = initial integration + 12 × (monthly platform charges + related infrastructure + internal support)
- Hybrid: include development effort, platform fees and maintenance on both sides.
Also account for the engineering work displaced from other priorities. Time spent on reporting may delay a feature central to your product’s competitive value.
When reviewing a vendor proposal, ask:
- Does the agreement permit customer-facing commercial embedding?
- What happens to costs as tenants or active viewers grow?
- Are capacity, queries, exports, refreshes and extra environments included?
- Which security, administration and white-label features need higher plans?
- Are there minimum commitments, overage fees or limits on scaling down?
- What would migrating reports and data models away from the platform involve?
The cheapest initial integration is not automatically the lowest-cost decision, and an expensive enterprise platform is not justified merely because you expect to grow.
What Makes Embedded Analytics Usable, Not Just Functional?
A report can be technically correct and still fail customers. Usability depends on whether users understand the numbers, trust them and can act without unnecessary effort.
Place reports inside existing workflows. If support managers live in a ticket queue, the response-time report should be reachable from it, and clicking a problem team should lead to relevant tickets rather than an unrelated reporting environment. Keep familiar navigation and terminology.
Explain metrics and freshness. Every important metric needs one consistent definition. If a dashboard and an export disagree, the app needs a clear explanation or a defect investigation. Show the reporting period and a “Last updated” timestamp backed by real pipeline or query metadata.
Protect application performance. Aggregations, large date ranges and repeated requests can strain a busy transactional database. Depending on the workload, options include optimized queries and indexes, read replicas, precomputed aggregates or a dedicated reporting store, each with different costs and freshness trade-offs. Start from measured behavior: define a representative dataset, realistic concurrency and a target, such as the main report loading within three seconds at the 95th percentile under a defined test workload. That figure is illustrative, not a universal benchmark.
Plan for support early. Someone must investigate mismatched totals, new accounts with no reporting access and stale data. Causes can sit in application logic, permissions, data pipelines or the vendor. Assign ownership and basic diagnostics before rollout, and for a purchased platform clarify which problems the vendor investigates and which remain yours.
A Practical Roadmap for Implementing Embedded Analytics in SaaS
This roadmap is organized around completed decisions and testable outcomes rather than delivery dates.
Phase 1: Validate the Use Case and Reporting Contract
Owners: product manager, engineering lead and representative customers.
- Identify the recurring customer decision reporting should support.
- Define the primary metric, time period and permitted filters.
- Document required customer and user roles.
- Agree on data freshness and expected user actions.
Done when: one approved report specification exists with defined calculations and acceptance criteria.
Phase 2: Implement the Secure Data Path
Owners: backend or data engineering, with appropriate security review.
- Map existing identities and organizations to the reporting system.
- Implement the chosen tenant-isolation approach.
- Prepare data queries or analytics models.
- Check calculations against known example records.
- Run cross-tenant and role-based authorization tests.
Done when: authenticated requests return correct data for permitted users and cannot reveal unauthorized tenant records through the tested paths.
Phase 3: Integrate the Reporting Experience
Owners: frontend engineering, product design and backend engineering.
- Display the primary metric, team comparison and underlying records.
- Add the necessary date and team filters.
- Connect report interactions to authorized application workflows.
- Handle empty, loading, error and delayed-data states.
- Measure query and page performance under representative usage.
Done when: test users can answer the original customer question and reach the relevant records without help.
Phase 4: Prepare Support and Expand Deliberately
Owners: engineering, product and customer support.
- Monitor reporting failures, refresh delays and expensive queries.
- Document metric definitions and troubleshooting procedures.
- Record customer requests for additional filters, reports and exports.
- Review actual usage before extending the feature.
- Revisit build versus buy when requirements materially change.
Done when: the feature has an operational owner, support procedures and evidence of which improvements customers actually need.
A growing SaaS application does not need to predict every future analytics requirement at launch. It needs a sound access-control foundation, reliable reporting definitions and room to evolve without rebuilding what already works.
Embedded Analytics for SaaS: Frequently Asked Questions
Can an iframe be used securely for embedded analytics?
Yes. Security depends on authentication, authorization, correctly configured embedded access, session handling and the restrictions enforced by your application or analytics provider. Using a JavaScript SDK instead of an iframe does not automatically solve tenant isolation. Treat public or unauthenticated embedding with particular care when data is customer-specific, and never assume an unguessable link or visible filter is sufficient authorization.
Should every SaaS customer be able to create custom reports?
No. Custom report creation pays off when users have genuinely different questions and the product supports the governance it requires. For many operational SaaS applications, predefined reports with sensible filters are clearer and cheaper to start with. Introduce self-service when demand justifies the permissions, administration, support and performance work.
Can embedded analytics work with an existing SaaS database?
Yes. A narrow reporting feature can often use existing application data if the schema supports the metrics and queries run safely. As volume or complexity grows, a read replica, aggregated reporting tables or a separate analytics store may become appropriate. Decide based on observed performance, freshness needs and operational limits, not an assumption that every analytics project needs a data warehouse.
Does buying an embedded analytics platform eliminate security responsibility?
No. A platform may supply identity integration, permission systems and isolation features, but you remain responsible for configuring them correctly, mapping customers to the right data access and testing the complete integration.
Make Your First Embedded Analytics Feature Worth Maintaining
The immediate decision is not which platform has the most charts. It is which customer reporting problem deserves implementation first, what data can safely support it and how much analytics infrastructure your company should own.
Begin with one report that supports a real customer decision. Define the metric, establish tenant permissions, test unauthorized access and measure performance. If your existing stack can meet that narrow requirement reliably, building may be entirely reasonable. If customers need extensive self-service exploration and many customizable reports, evaluate an embedded platform against the same security, usability and ownership requirements.
If your team is planning embedded reporting for a SaaS product, DataColab can help scope the data integration, custom software development and applied analytics work around a defined first release. A good starting point is a single reporting specification, a clear tenant-access policy and a testable build-versus-buy decision.