
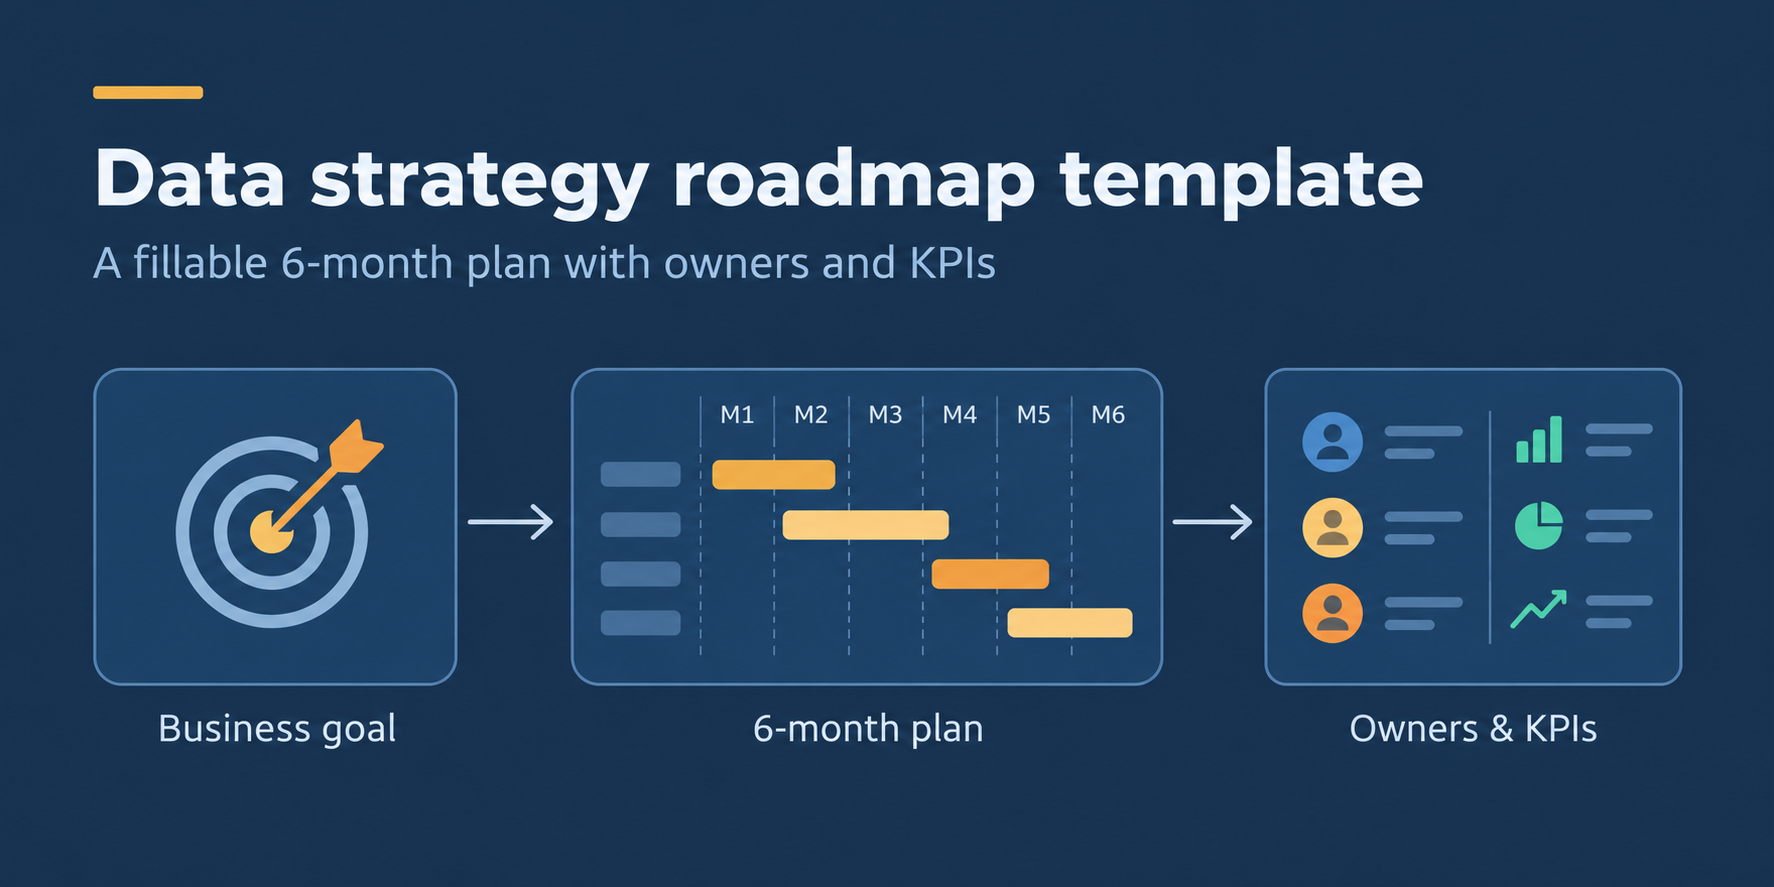
Data Strategy Roadmap Template: A Fillable 6-Month Plan with Owners and KPIs
A data strategy roadmap template helps business leaders turn data-related goals into a practical delivery plan. Instead of maintaining a disconnected list of dashboards, integrations, and governance initiatives, your team can agree on what needs to happen, who owns each task, when it should be completed, and how success will be measured.
The editable six-month template accompanying this guide is designed for founders, operations managers, data leads, and teams responsible for improving business reporting or data infrastructure. It includes worked examples and blank rows so you can replace the assumptions with your organisation’s actual requirements.
You do not need to establish a large data department or select an enterprise analytics platform before using it. Start with one valuable business outcome, identify the data needed to support it, and plan the smallest set of initiatives capable of delivering a reliable result.
What is included in this fillable six-month data strategy roadmap template?
- A six-month planning structure that connects business objectives to data initiatives, delivery milestones, and measurable results.
- Six completed example workstreams covering business goals, data inventory, governance, integration, reporting, and operational handover.
- Editable fields for accountable owners, priorities, dependencies, budgets, timelines, KPIs, milestone status, and next actions.
- An approval checklist to help business and technical stakeholders identify missing requirements before committing resources.
- A simple monthly review process for tracking progress, resolving blockers, and updating the plan when priorities change.
When should you use a data strategy roadmap template?
Use a data roadmap when achieving a business objective depends on coordinated changes to information, systems, responsibilities, or reporting processes.
Typical situations include:
- Reporting is inconsistent: Different teams produce conflicting revenue, customer, or operational figures.
- Information is fragmented: Important data is distributed across spreadsheets, databases, and SaaS applications.
- Ownership is unclear: Nobody knows who should resolve missing records, inconsistent definitions, or access problems.
- Manual reporting consumes time: Employees repeatedly export, clean, and reconcile information before making decisions.
- Analytics projects are difficult to prioritise: Teams have more ideas than available engineering capacity or budget.
- A new data initiative needs approval: Leadership needs a credible timeline, budget, responsibilities, and measurable acceptance criteria.
A six-month planning horizon is useful when the organisation can identify a few related initiatives and meaningful milestones. It is not a required industry standard. Some projects may need only several weeks, while complex migrations or cross-department programmes require a longer plan.
This template is deliberately focused on planning and tracking. If you want to see how data roadmaps differ across business types, the separate guide to data strategy roadmap examples explores completed scenarios for different organisations.
What is inside the editable six-month data strategy roadmap template?
The companion Excel workbook described in this guide is structured as a reusable six-month data roadmap. It has one roadmap sheet, six example milestones, eight blank rows for additional work, and an approval checklist.
The editable planning fields include:
| Field | Purpose | Example |
|---|---|---|
| Workstream | Groups related activities under an accountable area of work. | Data quality and integration |
| Priority | Shows which initiatives need attention first. | P1 |
| Milestone or deliverable | Defines the observable output that must be completed. | Validated revenue reporting feed |
| Accountable owner | Identifies the person responsible for delivery or acceptance. | Data engineer |
| Dependency | Records what must be available or approved before work proceeds. | Approved source access and consistent order identifiers |
| Start and due month | Establishes the intended delivery window. | M2–M4 |
| Budget assumption | Records planned resource or expenditure allocation. | $6,500, illustrative |
| KPI or baseline | Describes the current measurement or problem. | Unreconciled sales reporting differences |
| Acceptance target | Defines the evidence required to consider the milestone complete. | Net sales reconciles within an agreed 1% tolerance |
| Status | Tracks whether delivery has started, progressed, stalled, or finished. | In progress |
| Notes or next action | Records decisions, blockers, or the immediate follow-up. | Resolve unmatched marketplace refunds |
The worksheet includes dropdown options for priority, timeline month, and milestone status, alongside a formula that adds the entered budget amounts. The original example values can be edited, and additional milestones can be entered in the blank rows.
All sample budgets, ownership assignments, and targets are illustrative. They are not vendor quotations, verified industry benchmarks, or actual results from a completed project.
How to fill in the data roadmap template step by step
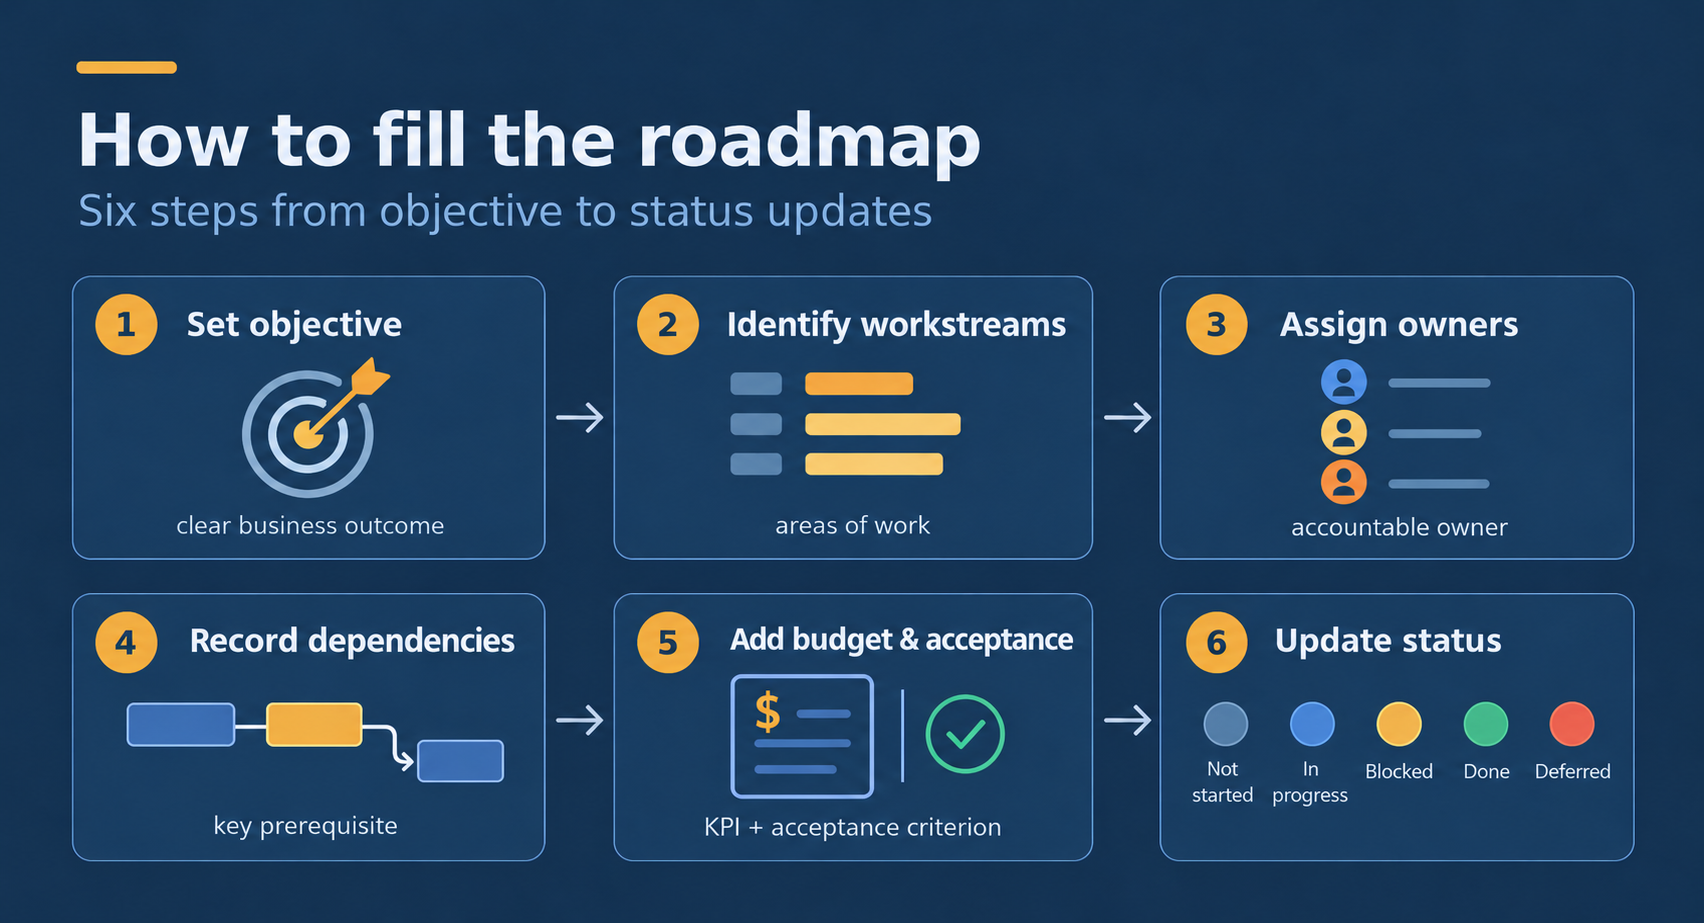
Step 1: Set one clear business objective
Start with a business problem that can be measured. Avoid objectives such as “improve our data” or “implement a modern data platform” unless they are connected to a specific operational need.
For example, a company might currently spend six staff hours every week producing sales and operations reports.
Its roadmap objective could be:
Reduce weekly manual reporting from six hours to two hours or less, while maintaining reliable reconciliation against approved source records.
This objective establishes both the expected benefit and a quality condition. Faster reporting is not valuable if the resulting figures cannot be trusted.
Enter the outcome in the workbook’s business objective field. If several objectives compete for the same resources, choose the highest-priority outcome for the initial plan and keep other initiatives in a separate backlog.
For a broader program, Roadmap Creator’s six-month data strategy roadmap guide recommends evaluating use cases by business value, data availability and implementation effort, then assigning owners and business-facing success metrics. Use those criteria to choose what enters your roadmap; do not add extra initiatives simply to fill six months.
Step 2: Identify the workstreams needed to deliver the outcome
Workstreams divide the project into areas with distinct responsibilities. They should describe necessary activities rather than departments or technologies included simply for completeness.
For a reporting improvement project, six useful workstreams are:
- Business goals and KPIs: Agree on reporting questions, metric definitions, and measurable targets.
- Data inventory and permissions: Identify relevant data sources, access constraints, and critical identifiers.
- Governance and ownership: Assign responsibility for definitions, source quality, and unresolved discrepancies.
- Data quality and integration: Establish validated processes for bringing required information together.
- Reporting and adoption: Deliver the report and incorporate it into regular operating decisions.
- Monitoring and handover: Document recurring checks, recovery procedures, and long-term operational ownership.
These are suggested categories, not mandatory workstreams for every organization. Remove any that do not serve the selected outcome. Add specialist activities only when requirements justify them.
Step 3: Assign an accountable owner to each milestone
Ownership should be specific enough that the team knows who can resolve a problem or approve completion.
A data engineer may be responsible for a technical integration, but the finance lead should normally approve the meaning and reconciliation of financial metrics. Similarly, a reporting analyst may create a dashboard while an operations manager decides whether the report is usable.
Replace example roles with actual names when adopting the worksheet. If several people contribute to a milestone, identify one accountable owner and record supporting contributors in the notes where needed.
Microsoft’s Fabric adoption roadmap guidance on governance recommends defining roles, decision-making and approval authority, along with measurable KPIs, dependencies and an iterative delivery plan. It also encourages a balance between user empowerment and appropriate controls. The guidance focuses on Microsoft Fabric, but these governance-planning principles can inform a technology-neutral data strategy roadmap.
Step 4: Record dependencies before committing to dates
Dependencies explain why a milestone cannot begin or finish until another activity is complete.
For example, building a reliable revenue dashboard depends on an agreed revenue definition, approved access to source systems, and the ability to reconcile transactions.
If the team schedules the dashboard before resolving those dependencies, development may proceed against assumptions that later prove incorrect.
Record the most important prerequisite in the dependency column. When it is unresolved, identify who can remove the blocker and what action is needed.
Step 5: Enter budget assumptions and measurable acceptance criteria
A budget is useful only when the team understands what it includes. Estimate internal staff time, external implementation assistance, licenses, infrastructure, data preparation, testing, and any other material costs.
Do not interpret example values in the workbook as market prices. Replace them with the organization’s own estimates and record significant uncertainty in the notes.
For every milestone, define what evidence would justify marking it complete.
“Dashboard delivered” is weaker than “dashboard values reconcile against approved financial records and the operations owner accepts it for weekly reporting.”
The second statement creates a testable outcome instead of leaving completion open to interpretation.
Keep two measures separate: a delivery acceptance criterion confirms that a milestone works (for example, an approved reconciliation test), while a business KPI confirms its value after adoption (for example, weekly reporting hours saved). Record the starting baseline and how each result will be measured.
Step 6: Update milestone status as work progresses
The worksheet provides five status values:
- Not started: Work has not begun.
- In progress: Delivery has started and is actively proceeding.
- Blocked: A prerequisite, issue, or decision prevents progress.
- Done: The agreed acceptance condition has been satisfied.
- Deferred: Work has been intentionally moved outside the current delivery plan.
A milestone should not be marked Done merely because an employee has finished writing code, creating a report, or preparing documentation. Completion should mean that the agreed result has been reviewed and accepted.
Worked example: a complete six-month data roadmap
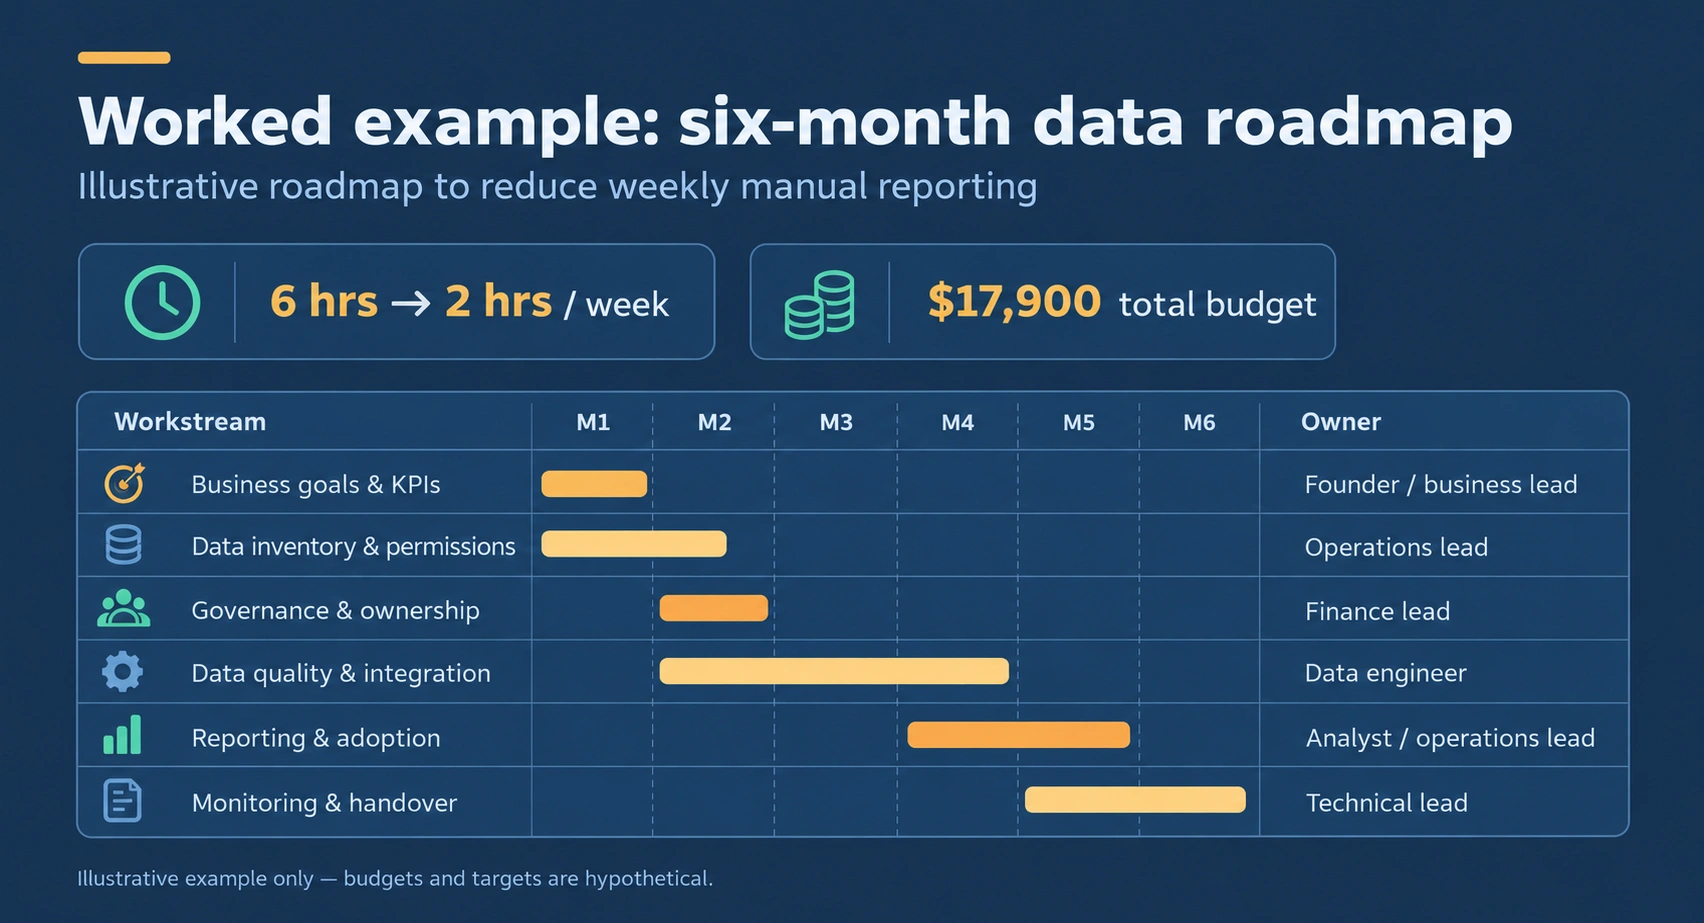
The following example is the starting content for the companion workbook. It describes a hypothetical business trying to reduce manual sales reporting and establish trustworthy operating metrics.
The organization already has several business systems but lacks consistent reporting definitions and repeatable data integration.
The six workstreams are sequenced so that critical definitions and permissions are addressed before the new reporting capability is accepted.
Six-month roadmap timeline at a glance
- Month 1: Approve the reporting objective, baseline, KPI definitions and source inventory scope.
- Month 2: Finish source mapping, permissions and governance ownership; begin the validated data integration.
- Months 3–4: Complete integration and reconcile reporting data before dashboard acceptance.
- Months 4–5: Launch the dashboard, establish weekly reviews and measure time saved.
- Months 5–6: Hand over monitoring, recovery procedures and operational responsibilities.
| Workstream and timing | Deliverable | Owner | Dependency | Budget | KPI and acceptance | Initial status |
|---|---|---|---|---|---|---|
| Business goals and KPIs M1 | Approve two reporting questions and their metric definitions. | Founder / business lead | Leadership agrees on the decisions the reports must support. | $1,500 | Record the six-hour weekly reporting baseline and approve metric definitions. | Not started |
| Data inventory and permissions M1–M2 | Map three source systems, key identifiers, and approved data access. | Operations lead | Business scope and source owners identified. | $2,500 | Confirm authorized access and document key source relationships. | Not started |
| Governance and ownership M2 | Assign data owners and exception-resolution rules. | Finance lead | Source inventory and business definitions approved. | $1,200 | Name an owner and escalation route for every priority dataset. | Not started |
| Data quality and integration M2–M4 | Build a validated reporting feed covering orders, refunds, and costs. | Data engineer | Source access, consistent identifiers, and mapping rules established. | $6,500 | Net sales reconciles within an agreed 1% tolerance on the reference sample. | Not started |
| Reporting and adoption M4–M5 | Publish a verified operations dashboard and establish weekly reviews. | Analyst / operations lead | Validated reporting feed and approved KPIs. | $4,000 | Reduce weekly reporting to two hours or less across four consecutive measured weeks. | Not started |
| Monitoring and handover M5–M6 | Document monitoring, recovery procedures, and long-term ownership. | Technical lead | Dashboard operational and support responsibilities agreed. | $2,200 | Responsible owner successfully completes a recovery walkthrough. | Not started |
Total illustrative budget: $17,900.
The table presents one completed milestone per workstream. It is sufficient as a small starter roadmap, but a real organization may divide individual workstreams into multiple milestones when different owners, dependencies, or acceptance decisions are involved.
All budget values and targets are hypothetical. The 1% reconciliation tolerance, for example, is a proposed planning threshold rather than a general accounting standard. The finance owner must determine an appropriate tolerance for the actual use case, including whether any discrepancies must be resolved completely.
How to track progress without making the roadmap complicated
A data roadmap should change when new evidence affects the plan. However, frequent changes to priorities and delivery dates can make it impossible to understand what was originally agreed.
Use a simple monthly review meeting focused on four questions:
- Which milestones have met their acceptance criteria?
- Which milestones are blocked, and who can remove the blocker?
- Have any dependencies, budgets, or delivery assumptions changed?
- Which decisions or approvals are required before the next review?
Update the status and notes fields after the meeting. Preserve important approval decisions in the organization’s normal project or document records rather than relying on informal conversations.
Example of a useful status update
Suppose the data integration workstream reaches Month 3 but refund records do not consistently match order identifiers.
| Field | Updated value |
|---|---|
| Workstream | Data quality and integration |
| Status | Blocked |
| Owner | Data engineer |
| Issue | Some marketplace refund records cannot be matched reliably to original orders. |
| Next action | Operations lead confirms source identifiers and resolves the mapping approach with the engineer. |
| Effect on dependent milestone | Dashboard acceptance remains on hold until financial reconciliation passes. |
This update is more informative than changing a percentage-complete figure from 70% to 75%. It explains the actual obstacle and the decision necessary to move forward.
Microsoft’s governance guidance also supports iterative planning and prioritizing tangible improvements rather than introducing all processes at once. A lightweight review process is usually easier to maintain when it focuses on real blockers, accountable owners, and meaningful outcomes.
Approval checklist: is your data strategy roadmap ready?
Before requesting funding or beginning implementation, use this checklist to identify material gaps.
| Approval question | Required evidence |
|---|---|
| 1. Is the business outcome clear? | A named business owner, defined problem, measurable baseline, and agreed target. |
| 2. Does each milestone have an accountable owner? | One person responsible for completion and a defined review or approval authority. |
| 3. Are data access and permissions approved? | Identified source systems, authorized data use, and appropriate security and privacy checks. |
| 4. Are critical dependencies identified? | Prerequisite decisions, source availability, integration requirements, and owners for unresolved blockers. |
| 5. Are budget assumptions documented? | Allocated internal effort, implementation costs, relevant tooling, and material uncertainty. |
| 6. Does every important deliverable have an acceptance condition? | Defined KPI, validation method, appropriate tolerance, and required sign-off. |
| 7. Is there a review and change process? | Monthly review arrangements, escalation responsibilities, and a method for recording approved changes. |
If a required permission is missing, a critical dependency has no owner, or the proposed reporting output cannot be validated, hold the relevant milestone until those issues are resolved.
Not every data initiative needs a formal governance committee. A small organization may manage approvals through existing leadership and technical responsibilities. The important requirement is knowing who can make each decision.
How to adapt the template to your Organization
The worked rows are designed to be replaced, not treated as mandatory activities. Adapt the roadmap using the following principles.
Keep the plan tied to one important outcome
A company preparing inventory reports may need source reconciliation and stock exception tracking. A professional services firm may need project identifiers, timesheet quality, and labor-cost definitions. A SaaS company may need event tracking and customer identity mapping.
Those organizations should not use identical workstreams or KPI definitions simply because they share a six-month template.
Use existing systems when they satisfy requirements
A roadmap does not need to prescribe a new warehouse, lakehouse, governance platform, or reporting application.
If existing systems can provide reliable information through supported integrations and appropriate controls, using them may reduce implementation complexity and cost.
Introduce additional infrastructure only when a specific requirement justifies it, such as larger workloads, more demanding reliability needs, or integrations that existing tools cannot support adequately.
Adjust the budget using available capacity
Distinguish between cash expenditure and allocated internal staff effort. Both consume resources, but they affect financial planning differently.
If a team member can contribute only a few hours per week, account for that constraint when setting dates. Do not assume that a six-month initiative can be compressed simply by lowering its budget.
Preserve quality and ownership controls
Data governance does not need to become a separate, large program before the first report is built. Still, each critical dataset should have appropriate ownership, access controls, and a process for resolving quality problems.
Where privacy, auditability or regulated data is in scope, use a data governance strategy for compliance and trust to define practical access decisions, data stewardship and evidence of control.
The goal is to apply the controls necessary for trustworthy business use without introducing avoidable bureaucracy.
Data strategy roadmap template: frequently asked questions
Which columns matter most in a data strategy roadmap?
At minimum, record the workstream, deliverable, accountable owner, dependency, due date, status, and measurable acceptance condition.
Budget assumptions, priority, and notes make the roadmap more useful for management decisions. If resources are constrained or several teams share responsibilities, these additional fields become particularly valuable.
How do I fill in the template if I have no existing data strategy?
Start with one problem and one measurable baseline. Identify the source information needed, assign business and technical owners, and record the first dependencies.
Use the completed sample rows as guidance rather than attempting to design a company-wide data programmed immediately. Replace them with tasks that directly support the selected outcome.
How often should I review data roadmap progress?
Monthly reviews are a reasonable default for a six-month roadmap. Teams performing active technical delivery may need shorter operational check-ins, while executives may review overall priorities less frequently.
Review immediately when a material blocker, budget change, risk, or business-priority shift affects the plan. Each review should produce decisions or next actions rather than just a status presentation.
Can I use the same template for a 12-month plan?
Yes. Extend the month fields and add the relevant milestones, budget periods, and review points. For a longer program, separating near-term committed work from later provisional initiatives may make the plan easier to manage.
Do not treat distant dates as guaranteed delivery commitments while major dependencies remain unresolved.
What is the difference between a data strategy roadmap and a project plan?
A data strategy roadmap shows how multiple related initiatives contribute to business outcomes over time. It establishes priorities, ownership, dependencies, milestones, and success measures.
A project plan typically describes the detailed work required to deliver one initiative, including individual tasks, technical activities, and resource scheduling.
For a small data initiative, one document may be sufficient for both purposes. Larger programmers often need separate technical project plans beneath the strategic roadmap.
Put the template to work
Start by replacing the example business objective with your organization’s most important reporting or data problem. Update the six workstreams, assign accountable owners, validate the budget assumptions, and agree on the first acceptance milestone.
Use the completed worksheet to align business and technical teams before beginning implementation. Review it monthly, keep blockers visible, and evaluate progress against measured outcomes rather than completion percentages alone.
If your roadmap identifies a reporting integration, internal application or workflow that existing tools cannot deliver reliably, explore custom software development for business workflows . DataColab can help clarify the requirements, assess data sources and scope a practical implementation.
A useful data strategy roadmap is not the most detailed document. It is the one that enables your team to make clear decisions, coordinate the necessary work, and demonstrate that the resulting data improvements are actually useful.