
Data Strategy Roadmap Examples: 3 Worked Plans for Real Business Teams
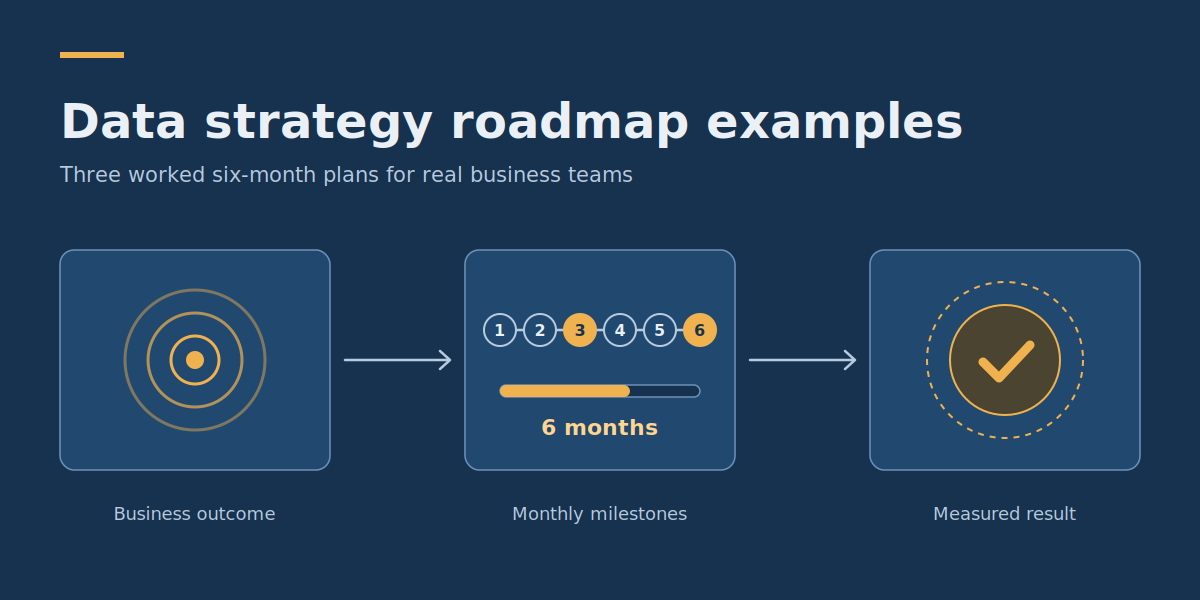
These data strategy roadmap examples show how three types of business team could turn fragmented information into better operational decisions. Explore worked six-month plans for a retail startup, an established services firm and a SaaS company, each with monthly deliverables, accountable owners, dependencies, budgets and measurable acceptance criteria.
Quick answer: Start with a decision the business needs to improve, agree on the relevant metrics, confirm ownership and data quality, then schedule the smallest set of deliverables needed to reach a measurable outcome.
About the examples: All three organizations, starting metrics, costs and results are hypothetical planning illustrations—not actual DataColab client projects, supplier quotations or verified performance outcomes. Example budgets are in US dollars.
Three data strategy roadmap examples at a glance
| Business team | Six-month goal | Illustrative budget | Success measure |
|---|---|---|---|
| 12-person retail startup | Daily net-sales, product-contribution and inventory reporting | $18,000 | Weekly preparation time falls from 6 hours to 2 or fewer |
| 80-person services firm | Reconciled project-profitability reporting | $45,000 | At least 95% on-time timesheets and no more than 60 unresolved eligible hours |
| 60-person SaaS company | Trustworthy workspace-activation and customer-lifecycle metrics | $72,000 | Validated 14-day activation cohorts used in product decisions |
These figures illustrate how plans can differ in scope and complexity; they are not typical prices or performance forecasts. Choose the example closest to the decision your team needs to improve.
What does a practical data strategy roadmap look like?
- A data strategy roadmap connects a specific business outcome to the data, people, systems, and milestones needed to achieve it.
- Every initiative should have an accountable owner, a delivery date, a dependency, an estimated cost, and a measurable acceptance criterion.
- A startup may need reliable sales and inventory reporting, an established services firm may need project profitability visibility, and a SaaS company may need trustworthy product and customer lifecycle metrics.
- Data quality, ownership, and metric definitions must be addressed before the business starts relying on new dashboards or automated reporting.
- The roadmap should deliver an operational improvement, not just a new data platform. Teams need to use its outputs in recurring business decisions.
A practical data strategy roadmap is a time-bound plan that connects a business result with the data, people, systems, milestones and tests needed to deliver it. Unlike a technology Wishlist, it shows what must happen first and how the organization will know a milestone is complete.
For example, reporting improvements must start with agreed metric definitions and reliable records. Otherwise, a new dashboard can make existing inconsistencies easier to see without resolving them.
What should every data strategy roadmap include?
A roadmap should be understandable to both the people funding the work and those responsible for delivering it. Each initiative needs enough information to support a decision about priorities, resources, and completion.
| Component | Question it answers | Practical example |
|---|---|---|
| Business outcome | Why are we doing this? | Give managers reliable project profitability information before the next billing cycle. |
| Baseline | What happens today? | Only 68% of weekly timesheets are completed by the reporting deadline. |
| Initiative | What work must be completed? | Connect approved timesheet, project, and invoicing information. |
| Owner | Who is accountable? | Finance controller owns margin definitions; data engineer owns the pipeline. |
| Dependency | What must happen first? | Project identifiers and cost allocation rules must be agreed. |
| Milestone | What will be delivered, and when? | An approved profitability model at the end of Month 3. |
| Budget | What resources are required? | Allocated staff time, implementation assistance, and software costs. |
| KPI and acceptance test | How will we know it worked? | Reported project margin reconciles to approved financial records within an agreed tolerance. |
These components make the roadmap an operating plan rather than a technology wish list.
Microsoft’s guidance on Fabric governance emphasizes clear ownership and stewardship, an appropriate balance between user access and safeguards, and iterative governance rather than unnecessary upfront bureaucracy. These principles can inform a broader data roadmap, although the guidance itself specifically addresses Microsoft Fabric and business intelligence.
Before building a roadmap, assess your current data maturity
A company with reliable, well-defined data can move quickly toward analysis. A company with inconsistent records must first resolve the specific quality issues that affect its intended decisions.
Use a short assessment rather than beginning with a lengthy organization-wide maturity program.
| Dimension | Early stage | Developing | Established |
|---|---|---|---|
| Data availability | Information is scattered across spreadsheets and applications. | Important systems can be accessed, but integration is incomplete. | Priority datasets are accessible through supported, repeatable processes. |
| Data quality | Definitions conflict and records regularly require manual correction. | Known quality checks exist for selected datasets. | Critical datasets have documented rules, owners, and monitored exceptions. |
| Ownership | No clear person resolves data discrepancies. | Some datasets have owners, but responsibilities overlap. | Business and technical responsibilities are explicitly assigned. |
| Decision-making | Reports are created manually or questioned in meetings. | Recurring reports are used, but teams still reconcile conflicting figures. | Trusted metrics are embedded in defined operating decisions. |
This is a lightweight diagnostic, not a certified maturity assessment. Classify each dimension based on observable evidence rather than selecting a maturity level to match a desired outcome.
For example, a company may have a sophisticated analytics platform but still be at an early stage in metric ownership. Buying another platform will not resolve disagreements about what counts as revenue or an active customer.
With the baseline established, the next step is to choose a roadmap appropriate to the organization’s real needs.
Data strategy roadmap example 1: a startup building reliable commercial reporting
Scenario and business objective
Consider a hypothetical 12-person online retail startup selling products through its own website and a marketplace.
The founder wants to understand which products contribute to profitability and which inventory decisions need attention. However, sales, refunds, fulfilment costs, and inventory records are maintained in separate systems.
Every week, employees export files and reconcile totals manually. Sales figures may look different depending on whether a report includes refunded orders, marketplace fees, or shipping expenses.
The immediate data strategy should not be an expensive enterprise data platform. The business needs one agreed commercial reporting model and a dependable process for updating it.
Illustrative starting assumptions:
- Approximately 2,000 orders per month.
- Four important source systems: online storefront, marketplace, payments, and inventory/fulfilment.
- Weekly commercial reporting requires approximately six staff hours.
- Product profitability calculations are not yet consistently defined.
- The founder can allocate limited internal time and obtain part-time technical assistance.
Six-month business objective: Produce a trusted daily view of net sales, product contribution, and inventory exceptions, reducing manual weekly reporting from six hours to two hours or less.
Startup roadmap: six monthly milestones
The following budget is an illustrative all-in allocation of $18,000 across six months, including technical assistance, allocated internal time, tooling, and a small allowance for adjustments. It is not a market quotation.
| Month | Deliverable and owner | Dependency or acceptance gate | Sample budget |
|---|---|---|---|
| 1: Define | Founder and finance adviser agree definitions for net sales, returns, product costs, and contribution margin. Document current reporting time. | Metric definitions approved; required sources and authorized access identified. | $2,000 |
| 2: Connect | Part-time data engineer establishes repeatable ingestion from the storefront, payments, and marketplace. Document identifiers and refresh behavior. | Approved API access available; test orders can be matched without uncontrolled duplication. | $4,000 |
| 3: Reconcile | Finance adviser and engineer incorporate refunds, product costs, and fulfilment records into an agreed reporting model. | Differences against approved financial totals are explained; monthly net-sales variance is within the agreed 1% tolerance. | $3,000 |
| 4: Report | Operations lead and analyst release a dashboard showing daily net sales, product contribution, and available inventory. | Founder verifies selected figures against source records and approves the dashboard for management use. | $4,000 |
| 5: Act | Operations lead introduces a weekly review of low-margin products and inventory exceptions. | Every exception has an identifiable source and a documented action or reason for deferral. | $3,000 |
| 6: Transfer | Founder and technical owner document definitions, refresh failures, access permissions, and the operating review process. | Weekly reporting requires no more than two staff hours on a representative four-week measurement period. | $2,000 |
Total illustrative allocation: $18,000.
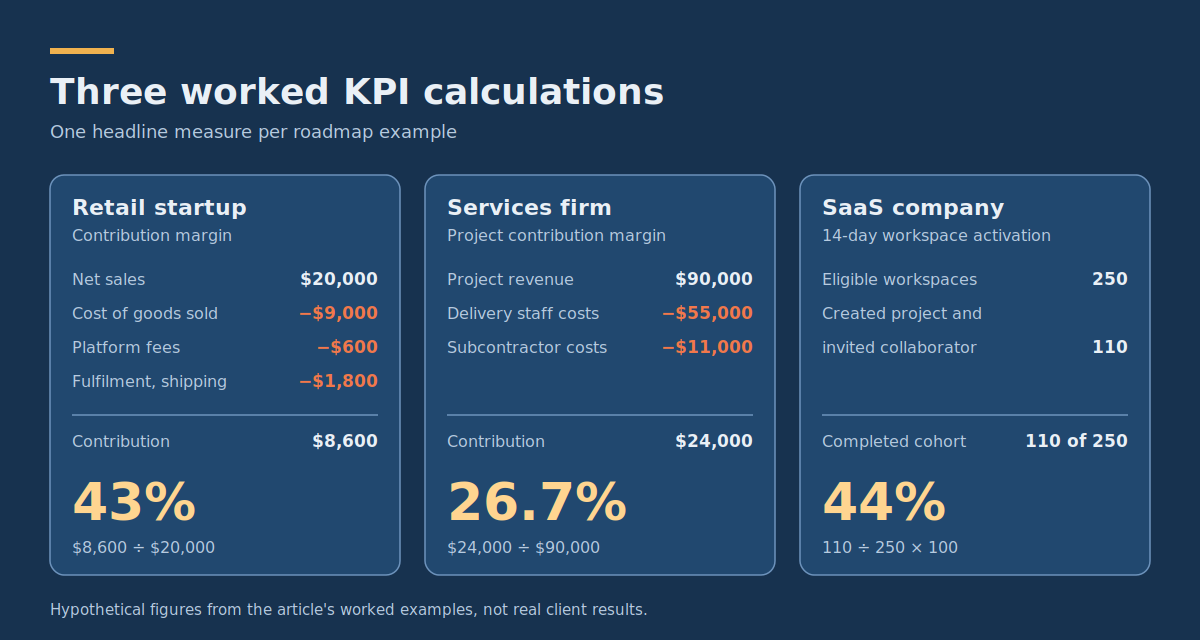
Worked KPI: product contribution margin
Suppose the company reports the following illustrative figures for one product group during a month:
| Metric | Amount |
|---|---|
| Net sales after discounts and refunds | $20,000 |
| Cost of goods sold | $9,000 |
| Payment and marketplace fees | $600 |
| Fulfilment and outbound shipping costs | $1,800 |
| Contribution | $8,600 |
| Contribution margin | 43% |
Contribution is calculated as $20,000 minus $9,000, $600, and $1,800. The margin is $8,600 divided by $20,000.
This is a simplified illustrative contribution measure. It excludes fixed overhead and other costs not listed. The business must define how refunds, returned inventory, taxes, and shipping charges are treated so that costs are not counted twice.
The dashboard becomes useful when the founder can compare products using consistently calculated values and use those comparisons in purchasing or pricing decisions.
How to judge the startup roadmap
By Month 6, the project should demonstrate more than an automated report:
- Financial definitions are agreed and documented.
- Critical source records can be matched and reconciled.
- Reporting time has fallen from the measured baseline.
- Inventory and margin exceptions are reviewed in recurring meetings.
- A named owner can investigate failed updates or disputed figures.
If the company cannot reconcile sales and refunds in Month 3, it should defer additional dashboards until that problem is resolved. Otherwise, faster reporting would simply distribute unreliable numbers more efficiently.
Data strategy roadmap example 2: an established services firm improving project profitability
Scenario and business objective
Now consider a hypothetical professional services firm with 80 employees delivering consulting and implementation projects.
It uses a CRM for sales opportunities, a project management system for delivery, a timesheet application for employee hours, and accounting software for invoicing.
The systems are individually useful, but managers do not have a consistent view of project financial performance. Timesheets arrive late, project codes differ across systems, and the finance team spends significant time reconciling delivery effort with invoices.
Unlike the startup example, the main challenge is not collecting initial sales data. It is connecting established operational records to financial decisions across multiple departments.
Illustrative starting assumptions:
- 80 employees across multiple delivery teams.
- Only 68% of weekly timesheets arrive by the reporting deadline.
- Approximately 140 eligible delivery hours remain unbilled or unresolved at the monthly review point.
- Project identifiers and labor-cost allocation rules are inconsistent.
- The business already has reporting tools and can allocate finance, delivery, and technical staff to the project.
Six-month business objective: Establish trusted project-level profitability reporting, raise on-time timesheet completion to at least 95%, and reduce unresolved billable hours to 60 or fewer at the monthly review point.
Services firm roadmap: six monthly milestones
This example uses an illustrative $45,000 six-month budget, including allocated internal effort, data engineering, reporting development, training, and contingency. Existing core business software license costs are assumed to remain unchanged.
| Month | Deliverable and owner | Dependency or acceptance gate | Sample budget |
|---|---|---|---|
| 1: Diagnose | COO and finance controller map the project-to-invoice process, identify reporting gaps, and establish baseline timesheet and billing metrics. | Project profitability definition and reporting scope approved by finance and delivery leadership. | $5,000 |
| 2:Standardize | Finance controller and delivery managers agree canonical project identifiers, labor-cost rules, timesheet deadlines, and ownership of corrections. | Active project mappings approved; unresolved identifiers are routed to named owners. | $9,000 |
| 3: Integrate | Data engineer connects approved timesheet, project, and accounting data into a consistent reporting model. | Selected projects reconcile to source transactions; duplicate and missing records are identified. | $10,000 |
| 4: Validate | Finance controller and BI analyst deliver a project profitability report with drill-down to the relevant source records. | Sample project revenue and allocated delivery costs reconcile within the agreed 2% tolerance, with exceptions documented. | $9,000 |
| 5: Adopt | Delivery managers begin weekly reviews of missing timesheets, unbilled eligible effort, and project profitability exceptions. | All active delivery teams participate; correction and escalation responsibilities are operational. | $7,000 |
| 6: Stabilize | COO and finance controller review results, document recurring processes, and assign long-term ownership. | At least 95% on-time timesheet completion and no more than 60 unresolved eligible hours at the agreed monthly review point. | $5,000 |
Total illustrative allocation: $45,000.
Worked KPI: project contribution margin
Suppose a project has the following illustrative figures for its reporting period:
| Metric | Amount |
|---|---|
| Recognized project revenue | $90,000 |
| Allocated employee delivery costs | $55,000 |
| Subcontractor and other direct delivery costs | $11,000 |
| Project contribution | $24,000 |
| Project contribution margin | 26.7% |
Project contribution equals $90,000 minus $55,000 and $11,000. The resulting contribution margin is approximately 26.7%.
These figures exclude unallocated corporate overhead and assume that revenue and delivery costs relate to the same reporting period. The organization must agree on revenue recognition, internal labor-cost rates, subcontractor treatment, and the allocation of shared resources.
This distinction matters. A dashboard showing billed revenue against timesheet hours may not produce meaningful project profitability if employee costs or revenue timing are inconsistent.
Who owns the services firm’s data?
Multiple owners are necessary because the data crosses organizational boundaries:
- COO: Accountable for the business outcome, project priority, and delivery-team adoption.
- Finance controller: Owns revenue and project-cost definitions, reconciliation, and acceptance of financial results.
- Delivery managers: Own timely timesheet completion and correction of operational records.
- Data engineer: Owns the technical integration, monitoring, and documented failure handling.
- BI analyst: Owns report implementation and works with finance to validate displayed metrics.
Ownership does not mean giving every team unrestricted access to all source information. Individual payroll or compensation data may require restricted handling, while aggregated, approved project-cost metrics may be sufficient for delivery reporting.
At the end of Month 6, leadership should evaluate whether project managers are using the information to identify overruns, correct billing gaps, and make delivery decisions earlier.
Improved dashboards alone do not prove that project profitability has improved. Changes in margins, invoicing, and delivery performance should be measured separately.
Data strategy roadmap example 3: a SaaS company building trustworthy product analytics
Scenario and business objective
The third example is a hypothetical subscription software company with approximately 60 employees.
Its product team tracks user activity, its commercial team manages accounts in a CRM, and its finance team manages subscriptions and payments through a billing platform.
Leadership wants to understand how newly acquired customers activate, adopt key features, and continue using the product.
The difficulty is that the systems use different identifiers, product events have inconsistent definitions, and reporting teams disagree about what counts as an active customer.
Buying a new dashboard would not resolve those disagreements. The company needs consistent event definitions, trustworthy account identity mapping, and an agreed measurement process.
Illustrative starting assumptions:
- Approximately 250 new trial workspaces per month.
- Product events, CRM accounts, and billing subscriptions exist in separate systems.
- Some accounts appear more than once because individual users and organizations use different identifiers.
- Product activation is discussed in management meetings but lacks a consistently approved definition.
- The company has a product manager, engineering team, and analyst capacity available for a focused project.
Six-month business objective: Establish a trusted activation metric, improve the completeness and reliability of the underlying customer lifecycle data, and incorporate the results into recurring product decisions.
Any improvement in activation or retention must be evaluated separately from the technical delivery of the reporting system. Reliable analytics can inform product experiments, but creating a dashboard does not automatically change customer behavior.
SaaS roadmap: six monthly milestones
This scenario uses an illustrative $72,000 allocation for six months, including assigned product and engineering time, analytics implementation, approved infrastructure, testing, and training. The company is assumed to retain its existing product and billing platforms.
| Month | Deliverable and owner | Dependency or acceptance gate | Sample budget |
|---|---|---|---|
| 1: Define | Product manager and revenue operations lead agree activation, trial cohort, paying customer, and account lifecycle definitions. | Definitions approved and relevant source systems identified; privacy and access requirements reviewed. | $10,000 |
| 2:Instrument | Product engineering team standardizes critical events, timestamps, workspace identifiers, and event tracking documentation. | Required events are tested across supported product journeys and releases. | $15,000 |
| 3: Integrate | Data engineer connects permitted product, CRM, and billing information using documented identity and matching rules. | Representative accounts reconcile; ambiguous identity matches are flagged rather than silently merged. | $17,000 |
| 4: Validate | Analytics lead delivers an approved activation cohort model and dashboard with event-completeness and freshness checks. | Calculated activation results match independently checked reference samples within the agreed tolerance. | $12,000 |
| 5: Apply | Product manager introduces weekly cohort reviews and uses findings to select onboarding experiments. | Experiment questions, cohort definitions, and measurement periods are recorded before changes are released. | $10,000 |
| 6: Review | Product and analytics leads assess measurement reliability, document ownership, and agree the next analytics priorities. | Critical event data meets the agreed freshness and completeness tests; the activation report is used in recurring product reviews. | $8,000 |
Total illustrative allocation: $72,000.
Worked KPI: 14-day workspace activation
For this example, the company defines activation as a new trial workspace completing both of these actions within 14 days of signup:
- Creating its first project.
- Inviting at least one collaborator.
The activation rate is the number of eligible trial workspaces completing both actions within 14 days divided by the total number of eligible new trial workspaces in the cohort.
Assume a reporting cohort contains 250 workspaces that have each had a full 14-day observation period. Of those, 110 completed both actions within the permitted window.
Activation rate = 110 ÷ 250 × 100 = 44%.
Suppose another 15 recently created trial workspaces have not yet reached their 14-day observation deadline. They should not be mixed into that completed cohort’s denominator when reporting the final 14-day activation rate.
This is a hypothetical metric definition and calculation. The chosen actions should be justified against the product’s intended user value, not adopted simply because they are easy to track.
The team must also ensure that multiple user accounts within one workspace are not counted as separate trial workspaces and that event timestamps are handled consistently.
How do product analytics turn into business decisions?
Once the activation data is reliable, the product manager can compare eligible cohorts, identify where workspaces stop progressing, and formulate onboarding experiments.
For instance, analysis may show that many users create a project but do not invite a collaborator. That observation could justify investigating invitation usability, team onboarding expectations, or the relevance of collaboration to customer value.
It does not prove that the invitation process causes customer churn or that changing it will improve retention. Those hypotheses require additional evidence and appropriate testing.
The roadmap’s success should therefore be measured in two layers:
- Data delivery: Event reliability, identity matching, consistent definitions, reporting freshness, and reproducible calculations.
- Business use: Whether product decisions are informed by the metrics and whether subsequent experiments demonstrate worthwhile outcomes.
Separating those layers prevents the data team from being credited or blamed for customer behavior it cannot directly control.
Compare the three data strategy roadmap examples
The same planning principles apply across the scenarios, but the appropriate investment and operational requirements differ considerably.
| Dimension | Retail startup | Services firm | SaaS company |
|---|---|---|---|
| Main business problem | Inconsistent commercial and inventory reporting | Limited visibility into project profitability and billable work | Unreliable product activation and customer lifecycle metrics |
| Primary business owner | Founder | COO and finance controller | Product manager |
| Technical focus | Basic source integration and reconciliation | Cross-system identifiers, cost allocation, and reporting | Event instrumentation, identity mapping, and cohort analysis |
| Illustrative six-month budget | $18,000 | $45,000 | $72,000 |
| Primary delivery KPI | Trusted contribution reporting with lower manual preparation time | Reconciled project profitability with improved timesheet completeness | Validated activation measurement used in product reviews |
| Principal dependency | Consistent sales, refund, and product-cost definitions | Common project identifiers and cost allocation rules | Reliable event definitions and workspace-level identity |
The budget difference does not imply that every SaaS company requires more data investment than every services business. These are scenario-specific resource assumptions.
The important lesson is that a roadmap should be proportional to the business outcome, available capabilities, technical dependencies, and risks.
How to sequence the work in a data strategy roadmap
A common planning error is to organize the roadmap around technology components rather than the dependencies needed for useful business results.
For example, a team may start building dashboards before deciding which system owns the customer record. When the reports disagree, the organization must revisit its definitions, integration logic, and acceptance tests.
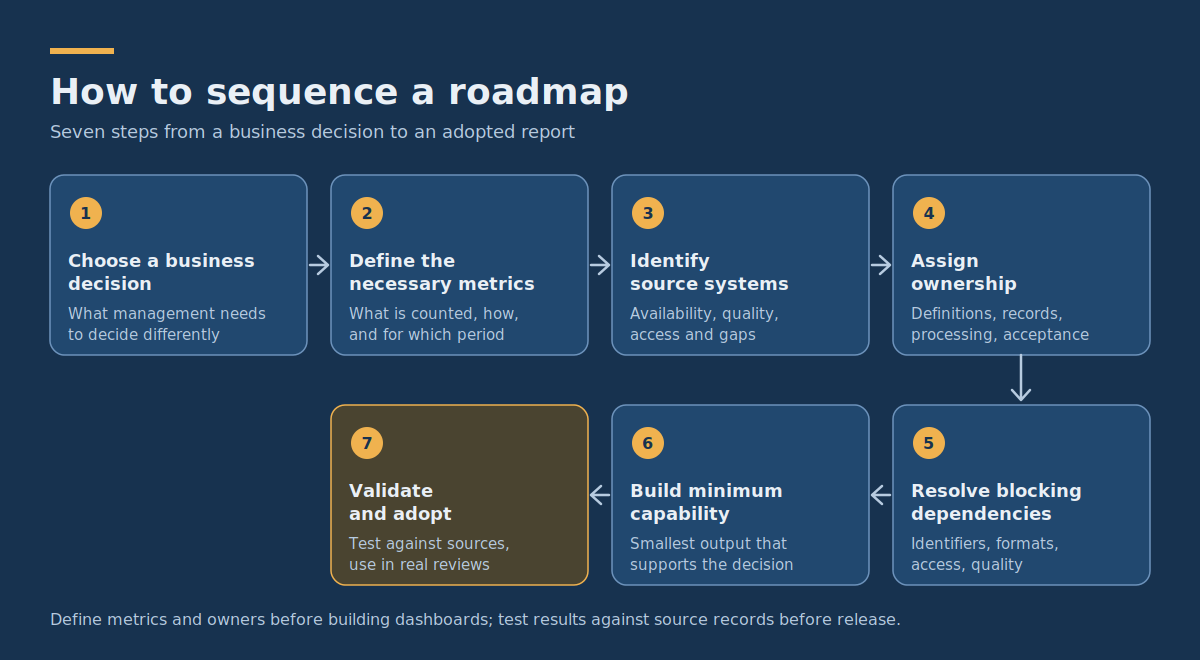
A more reliable sequence is:
- Choose a business decision: Identify what management or employees need to decide differently.
- Define the necessary metrics: Agree on what will be counted, how it is calculated, and which reporting period applies.
- Identify source systems: Confirm data availability, quality, access, and known gaps.
- Assign ownership: Separate accountability for business definitions, source records, technical processing, and report acceptance.
- Resolve blocking dependencies: Address missing identifiers, inconsistent formats, access restrictions, or quality problems that would invalidate the result.
- Build the minimum reporting capability: Deliver the smallest data integration and analytical output that supports the intended decision.
- Validate and adopt: Test results against source evidence, integrate them into a real operating process, and measure whether the change is useful.
The Roadmap Creator’s data strategy roadmap template outlines use-case discovery, current-state assessment, governance foundations, implementation, analytics delivery and adoption. The plans here adapt that sequence to each organization’s constraints; they do not assume every business needs a new enterprise data platform.
Not every project requires a warehouse, lakehouse, machine learning platform, or enterprise data catalogue. Introduce those capabilities when the chosen use cases and operational requirements justify them.
When disconnected operational systems are the main blocker, targeted custom software development for business workflows can help connect approved data flows and reduce manual handoffs. Confirm the expected benefit, ongoing maintenance requirements and ownership before deciding to build a custom integration.
Who should own each part of a data strategy roadmap?
Ownership must distinguish between defining a metric, maintaining source information, implementing data systems, and approving business decisions.
A data engineer should not be expected to decide what counts as recognized revenue. Similarly, a finance leader may own the revenue definition without being responsible for maintaining the underlying data pipeline.
| Role | Accountability | Example decision |
|---|---|---|
| Executive sponsor | Business priorities, budget, and cross-team decisions | Which initiative receives funding first? |
| Business data owner | Meaning, intended use, and acceptance of business data | What counts as an active customer? |
| Data steward or operational owner | Day-to-day quality, corrections, and exception resolution | Who fixes missing project identifiers? |
| Technical owner | Integration, processing, access implementation, monitoring, and reliability | How are failed source updates recovered? |
| Analytics owner | Metric implementation, testing, reporting, and documentation | Does the dashboard reproduce the agreed calculation? |
| Operational users | Using the output and reporting problems | Which action follows an exception identified in the report? |
One person may perform several roles in a small business. The requirement is clear accountability, not a large permanent governance structure.
Microsoft’s Fabric governance guidance highlights the importance of clear ownership and stewardship, and of involving business units in governance decisions. In these roadmap examples, business owners approve metric definitions while technical owners implement and maintain the agreed processing rules.
How to measure data strategy roadmap progress
A milestone should not be considered successful merely because its scheduled date has passed or a deliverable has been uploaded.
Use two classes of measurements: delivery measures that establish whether the data capability works, and business measures that establish whether it improves the intended outcome.
Delivery KPIs
These show whether the data foundation is usable:
- Completeness: Required records or fields present divided by those expected in the defined population.
- Freshness: Percentage of required updates arriving within the agreed reporting window.
- Reconciliation: Difference between a new analytical result and an approved reference calculation.
- Exception resolution: Percentage of identified issues resolved within an agreed time.
- Adoption: Whether the intended users complete the defined review or decision process using the data.
Business KPIs
These depend on the use case:
- The retail startup measures reporting time, product contribution, and the usefulness of inventory decisions.
- The services firm measures timely timesheets, unresolved billable effort, and project financial visibility.
- The SaaS company measures trustworthy activation cohorts and, separately, the results of subsequent product experiments.
Each KPI needs a written definition, a baseline, a target, an owner, and a measurement frequency. Otherwise, two teams may report different results while both believe they are measuring the same outcome.
Where the baseline cannot yet be measured reliably, make baseline establishment an explicit early milestone instead of inventing a number.
How to adapt a data strategy roadmap example to your business
Use whichever scenario most closely matches your operational problem, then change the inputs before copying its schedule or budget.
Start by writing one initiative record with the following information:
| Field | Illustrative completed record |
|---|---|
| Business outcome | Reduce time spent preparing weekly project profitability reports. |
| Current baseline | Eight staff hours per weekly reporting cycle. |
| Target | Three hours or fewer, without increasing unresolved reconciliation differences. |
| Accountable owner | Finance controller. |
| Technical delivery owner | Data engineer. |
| Sources | Timesheets, project records, and accounting transactions. |
| Dependencies | Agreed project identifiers, cost rates, and approved source access. |
| First deliverable | Verified reporting model covering an agreed pilot group of projects. |
| Review date | End of Month 2. |
| Acceptance criterion | Pilot project financial values reconcile to approved source records within the agreed tolerance. |
| Next decision | Expand the reporting model, correct the identified issues, or stop the initiative. |
This illustrates how the roadmap can be adapted without copying a technology architecture that may be inappropriate for the business.
When a roadmap exposes broader problems involving ownership, access, confidentiality, or regulatory obligations, the separate guide to data governance strategy, compliance and trust provides additional context. Those controls should be proportionate to the information being processed and the applicable requirements.
Common reasons data strategy roadmaps fail
1. Starting with a platform instead of a business outcome
A roadmap that begins with “implement a data warehouse” may create infrastructure before anyone establishes which decisions it should support.
Begin with a defined business question, then select the minimum data capabilities needed to answer it reliably.
2. Leaving metric definitions unresolved
If finance and sales disagree about revenue, or product and commercial teams use different definitions of active customers, new dashboards can intensify those disagreements.
Require a designated business owner to approve definitions before the relevant reporting milestone is accepted.
3. Treating data integration as proof of data quality
A successfully completed API transfer does not establish that records are correct, complete, or suitable for a business calculation.
Test records against source evidence, validate key joins, and identify unresolved exceptions before releasing critical reports.
4. Assigning every problem to IT
Technical teams can build integrations and reporting systems, but they cannot independently decide how the organisation should recognize revenue, classify customers, or allocate financial costs.
Make business owners accountable for meaning and acceptance, with technical teams responsible for implementing the approved rules.
5. Planning milestones without accounting for dependencies
A dashboard may be scheduled for Month 3 even though the required source access will not be available until Month 4.
Record dependencies alongside each milestone. If a prerequisite is delayed, explicitly revise the affected downstream deliverable rather than concealing the problem.
6. Measuring completion rather than operational use
A technically correct report may create little value if employees never use it or still need to reconcile figures manually.
Include training, recurring review meetings, and observable business actions in the roadmap. Measure those activities after release.
7. Making the roadmap too large to maintain
An extensive planning document can consume significant time while offering little guidance about the next decision.
Start with a few high-value initiatives and enough structure to manage ownership, timing, cost, dependencies, and acceptance. Expand the plan when additional work is justified.
Frequently asked questions about data strategy roadmaps
What are three practical examples of a data strategy roadmap?
A retailer can priorities agreed sales and inventory metrics, a services business can reconcile projects, staff hours and invoicing, and a SaaS team can validate customer activation events. Each needs different source data and owners, but all three require measurable milestones, validation and routine business use.
What comes first in a data strategy roadmap?
The first step is to identify a measurable business outcome and understand how the relevant information is currently produced. Then assess source availability, quality, permissions, and ownership. These findings determine which dependencies need attention before technical delivery begins.
Who should own the data strategy roadmap?
An executive or business sponsor should be accountable for overall priorities and investment decisions. Individual workstreams need business owners for requirements and results, plus technical owners for implementation. A small organization may combine roles, but accountability should remain explicit.
What KPIs belong on a data strategy roadmap?
Include both technical measures, such as data completeness, freshness, and reconciliation accuracy, and business measures tied to the original objective. Examples include reporting hours reduced, unresolved billable work, reliable product activation measurement, or improved decision turnaround.
The correct KPI depends on the decision the roadmap is intended to improve.
How long should a data strategy roadmap cover?
Six months is a useful illustrative planning horizon for a focused set of initiatives, but it is not a universal requirement. A small reporting improvement may be achievable in weeks, while a complex cross-department integration may require multiple phases.
The plan should be long enough to show dependencies and funding requirements, but short enough to allow meaningful reassessment as results become available.
Does every data strategy need a new data platform?
No. A company may achieve its immediate goals using existing databases, supported integrations, and reporting tools. A larger platform becomes appropriate when the organization’s requirements for scale, integration, governance, reliability, or analytical workloads justify it.
The architecture should follow the business requirements rather than dictate them.
Choose one outcome and build a roadmap your team can execute
Begin with the example closest to your business problem. Replace its assumed baseline, available staff, system dependencies, budget, and acceptance criteria with your own verified information.
Then agree on the first milestone, assign an accountable owner, and identify the evidence required before the next stage can proceed. Review progress regularly, including whether the delivered data is being used to make better operational decisions.
If your organization needs help assessing its data systems, resolving integration dependencies, or turning a proposed data roadmap into deliverable work, consider discussing the scope with DataColab. A focused implementation discussion should identify the priority outcome, available information, constraints, responsible roles, and the first measurable milestone.
A useful data strategy roadmap does not need to contain every future initiative. It needs to make the next important improvements achievable, measurable, and accountable.
Pingback:Data Science Workflow: 8 Steps to Reliable Decisions
Pingback:Data Strategy Roadmap Template: Free 6-Month Excel Plan